| Fire incidents reported |
|---|
| Sreet name | Count |
|---|
| MT HOLLY RD | 44 | | GREEN POINT RD | 34 | | THOMPSONTOWN RD | 32 | | MOUNT HOLLY RD | 20 | | SUICIDE BRIDGE RD | 18 | | HAWKEYE RD | 16 | | MAIN ST | 12 | | RAILROAD RD | 12 | | CHOPTANK DR | 10 | | INDIAN CREEK RD | 10 | | LINKWOOD RD | 10 | | SPRINGDALE RD | 10 | | THOMPSON TOWN RD | 10 | | BEACH HAVEN RD | 8 | | BELLE AIRE RD | 8 | | RAILROAD AVE | 8 | | SATURN DR | 8 | | SNUG HARBOR RD | 8 | | ACADEMY ST | 6 | | BAKER RD | 6 | | CEDAR GROVE RD | 6 | | CENTENNIAL RD | 6 | | EAST NEW MARKET ELLWOOD RD | 6 | | HERITAGE RD | 6 | | ROUTE 14 | 6 |
| | | Fire incidents reported |
|---|
| Sreet name | Count |
|---|
| ROUTE 16 | 6 | | SANDY KNOLL DR | 6 | | WARWICK RD | 6 | | WEST HAVEN CT | 6 | | 16 RT | 4 | | CABIN CREEK | 4 | | CABIN CREEK RD | 4 | | CHATEAU RD | 4 | | CIRCLE DR | 4 | | CIRCLE DRIVE | 4 | | DOBSON RD | 4 | | EAST NEW MARKET HURLOCK RD | 4 | | HUBBARD RD | 4 | | LITTLE CREEK LN | 4 | | MAIN ST | 4 | | MESSICK RD | 4 | | MOUNT HOLLY RD | 4 | | MOUNT HOLLY ROAD | 4 | | MT HOLLEY RD | 4 | | MT HOLLY RD | 4 | | RED HILL RD | 4 | | RICHARDSON RD | 4 | | RT 16 | 4 | | SATURN DRIVE | 4 | | |
|
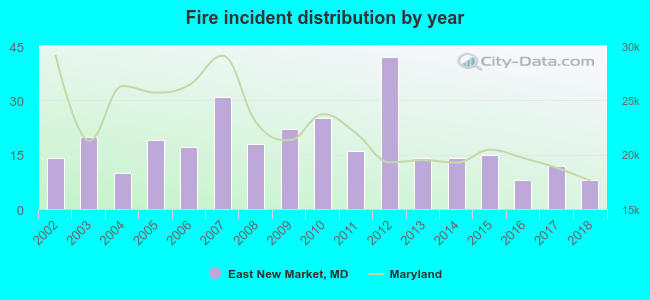 According to the data from the years 2002 - 2018 the average number of fires per year is 18. The highest number of reported fires - 42 took place in 2012, and the least - 8 in 2016. The data has a decreasing trend.
 26.2% incidents where reported in the morning and 73.8% in the evening. The most fires (18.7%) took place on Friday, and the least (11.8%) on Wednesday.
 Based on the 305 reports from years 2002 - 2018 most fires (15.7%) took place during July, and the least (4.3%) in January.
 Out of all 732 cases reported during the years 2002 - 2018, the most belonged to the categories: Fire (41.7%), Rescue & EMS (26.1%), and Good Intent Call (12.4%).
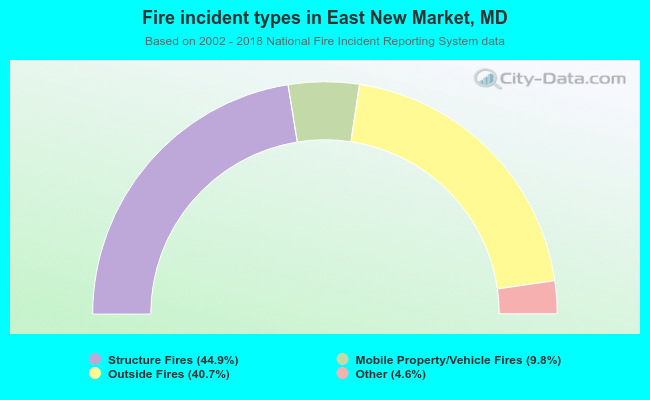 When looking into fire subcategories, the most reports belonged to: Structure Fires (44.9%), and Outside Fires (40.7%).