East Milton: Fire Incidents, Florida (FL)
Where are fire incidents reported in East Milton, FL
Something went wrong! Please refresh the page.
|
| |||||||||||||||||||||||||||||||||||||||||||||||||||||||||||||||||||||||||||||||||||||||||||||||||||||||||||||
2003 - 2018 National Fire Incident Reporting System (NFIRS) incidents
- Incident types reported to NFIRS in East Milton, FL
- 41858.4%Rescue & EMS
- 13518.9%Fire
- 9212.8%Good Intent Call
- 436.0%Service Call
- 152.1%False Alarm
- 81.1%Hazardous Condition
- 50.7%Special Incident
- Fire incident types reported to NFIRS in East Milton, FL
- 7152.6%Structure Fires
- 3727.4%Outside Fires
- 2317.0%Mobile Property/Vehicle Fires
- 43.0%Other
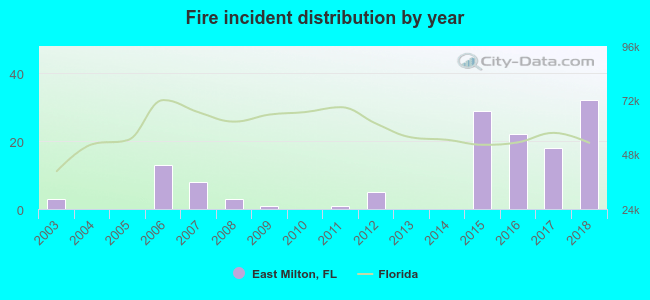 According to the data from the years 2003 - 2018 the average number of fire incidents per year is 8. The highest number of fire incidents - 32 took place in 2018, and the least - 0 in 2004. The data has a growing trend.
The average number of yearly fire incidents per 10k residents in East Milton, FL compared to nearest cities:
(Note: Based on data for the last 3 years, including only cities with population 5,000 and above)
| East Milton: | 21.7 |
| Milton: | 364.9 |
| Pace: | 72.2 |
| Pensacola: | 189.1 |
| Brent: | 0.5 |
| Navarre: | 34.4 |
| Cantonment: | 14.9 |
| West Pensacola: | 0.5 |
| Gulf Breeze: | 138.8 |
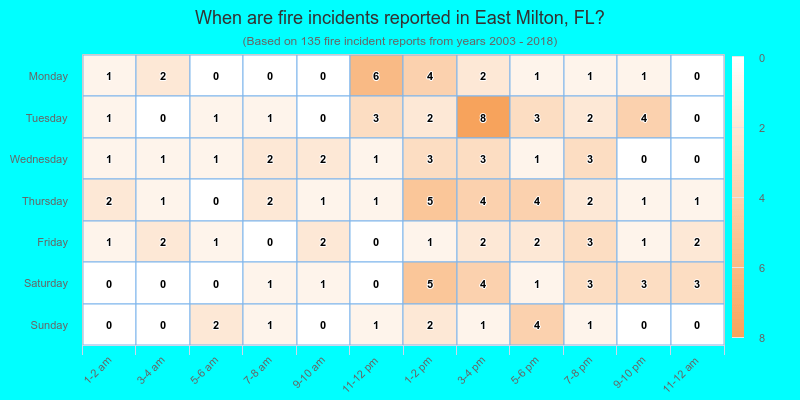
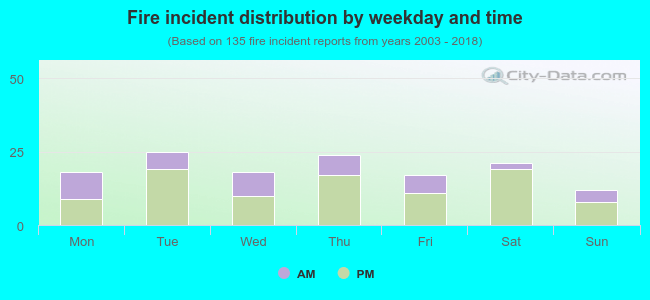 31.1% incidents where reported in the morning and 68.9% in the evening. The most fires (18.5%) took place on Tuesday, and the least (8.9%) on Sunday.
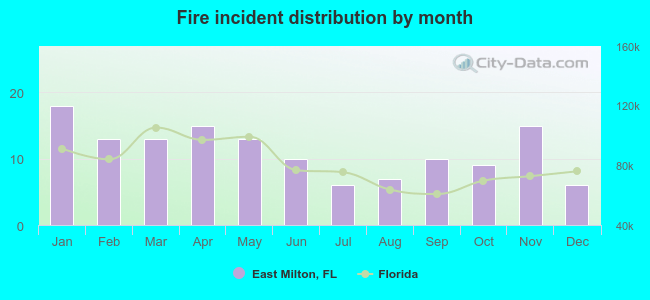 According to the 135 fire incident reports from years 2003 - 2018 most fires (13.3%) took place during January, and the least (4.4%) in July.
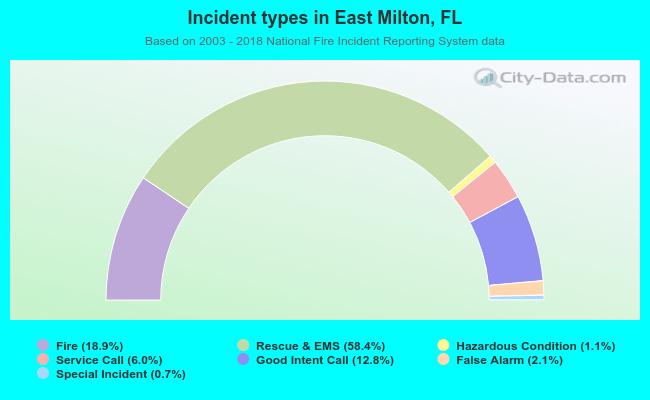 Out of all 716 cases reported during the years 2003 - 2018, the most belonged to the categories: Overpressure Rupture (58.4%), Fire (18.9%), and Service Call (12.8%).
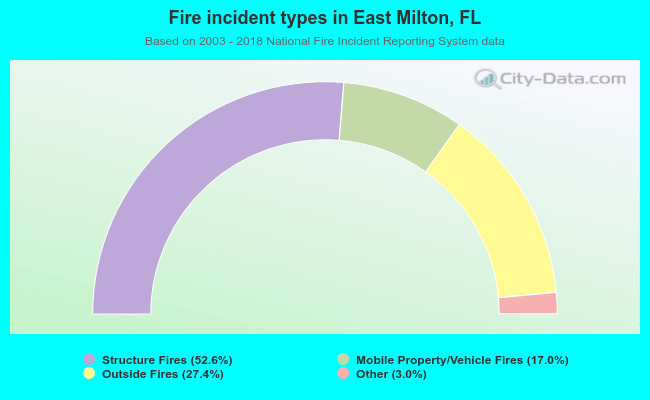 When looking into fire subcategories, the most reports belonged to: Structure Fires (52.6%), and Outside Fires (27.4%).