East Lansdowne: Fire Incidents, Pennsylvania (PA)
Where are fire incidents reported in East Lansdowne, PA
Something went wrong! Please refresh the page.
|
| |||||||||||||||||||||||||||||||||||||||||||||||||||||||||||||||||||||||||||||||||||||||||
2006 - 2018 National Fire Incident Reporting System (NFIRS) incidents
- Incident types reported to NFIRS in East Lansdowne, PA
- 10931.2%Fire
- 6518.6%Hazardous Condition
- 6117.5%Good Intent Call
- 5114.6%Rescue & EMS
- 4312.3%False Alarm
- 113.2%Special Incident
- 92.6%Service Call
- Fire incident types reported to NFIRS in East Lansdowne, PA
- 8174.3%Structure Fires
- 2119.3%Other
- 43.7%Outside Fires
- 32.8%Mobile Property/Vehicle Fires
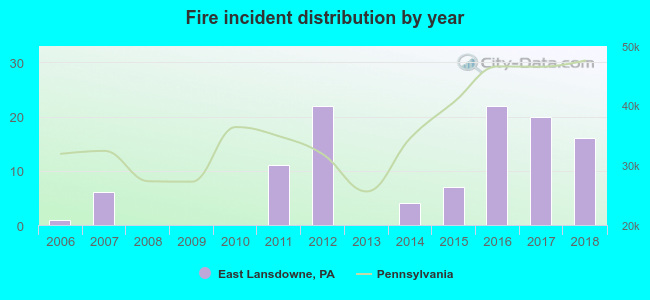 According to the data from the years 2006 - 2018 the average number of fires per year is 8. The highest number of fire incidents - 22 took place in 2012, and the least - 0 in 2008. The data has a rising trend.
 27.5% incidents where reported in the morning and 72.5% in the evening. The most fires (20.2%) took place on Wednesday, and the least (8.3%) on Thursday.
 Based on the 109 fire incident reports from years 2006 - 2018 most fires (19.3%) took place during May, and the least (1.8%) in October.
 Out of all 349 cases reported during the years 2006 - 2018, the most belonged to the categories: Fire (31.2%), Rescue & EMS (18.6%), and Service Call (17.5%).
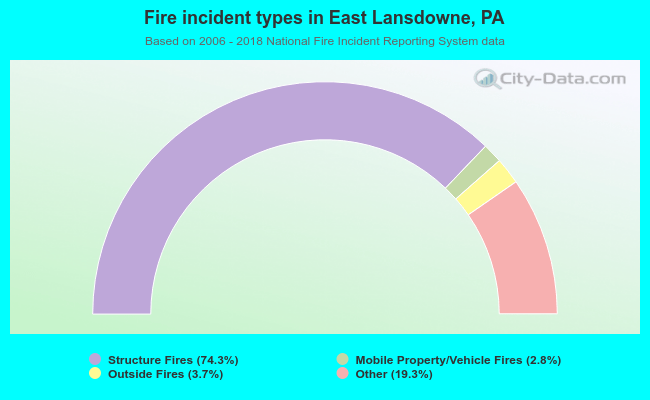 When looking into fire subcategories, the most incidents belonged to: Structure Fires (74.3%), and Other (19.3%).