East Islip: Fire Incidents, New York (NY)
Where are fire incidents reported in East Islip, NY
Something went wrong! Please refresh the page.
|
| |||||||||||||||||||||||||||||||||||||||||||||||||||||||||||||||||||||||||||||||||||||||||||||||||||||||||||||
2003 - 2018 National Fire Incident Reporting System (NFIRS) incidents
- Incident types reported to NFIRS in East Islip, NY
- 1,05038.8%Rescue & EMS
- 60422.3%Hazardous Condition
- 34912.9%False Alarm
- 34712.8%Good Intent Call
- 2127.8%Fire
- 1104.1%Service Call
- 160.6%Severe Weather
- 160.6%Special Incident
- 40.1%Overpressure Rupture
- Fire incident types reported to NFIRS in East Islip, NY
- 12559.0%Structure Fires
- 6430.2%Outside Fires
- 146.6%Mobile Property/Vehicle Fires
- 94.2%Other
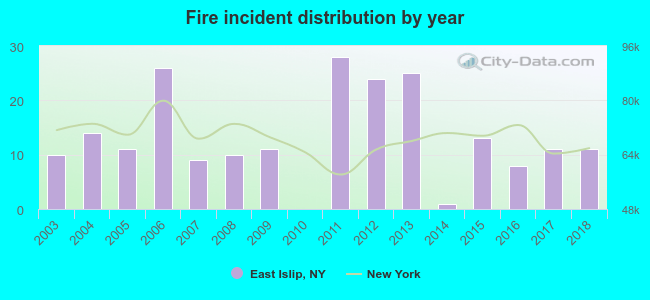 According to the data from the years 2003 - 2018 the average number of fire incidents per year is 13. The highest number of reported fires - 28 took place in 2011, and the least - 0 in 2010. The data has a growing trend.
The average number of yearly fire incidents per 10k residents in East Islip, NY compared to nearest cities:
(Note: Based on data for the last 3 years, including only cities with population 5,000 and above)
| East Islip: | 6.9 |
| Islip Terrace: | 14.2 |
| Islip: | 4.0 |
| Oakdale: | 31.4 |
| Bay Shore: | 44.6 |
| Central Islip: | 27.4 |
| West Sayville: | 19.3 |
| Bohemia: | 32.1 |
| Brentwood: | 21.8 |
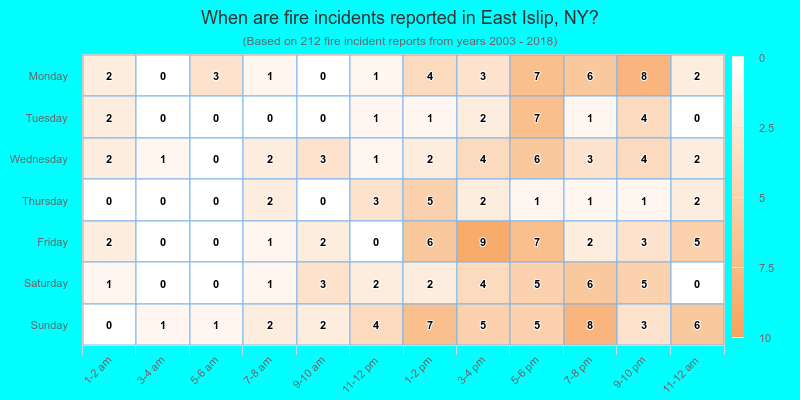
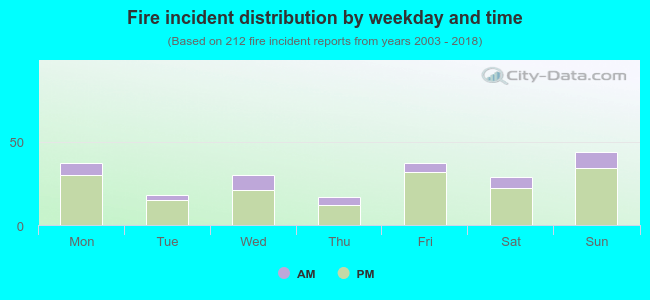 21.7% incidents where reported in the morning and 78.3% in the evening. The most fires (20.8%) took place on Sunday, and the least (8.0%) on Thursday.
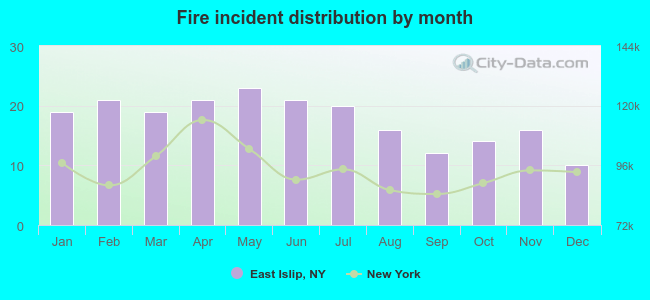 According to the 212 incident reports from years 2003 - 2018 most fires (10.8%) took place during May, and the least (4.7%) in December.
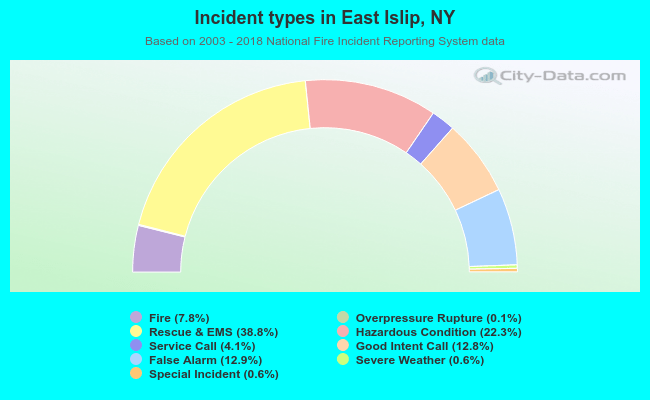 Out of all 2,708 cases reported during the years 2003 - 2018, the most belonged to the categories: Rescue & EMS (38.8%), Hazardous Condition (22.3%), and False Alarm (12.9%).
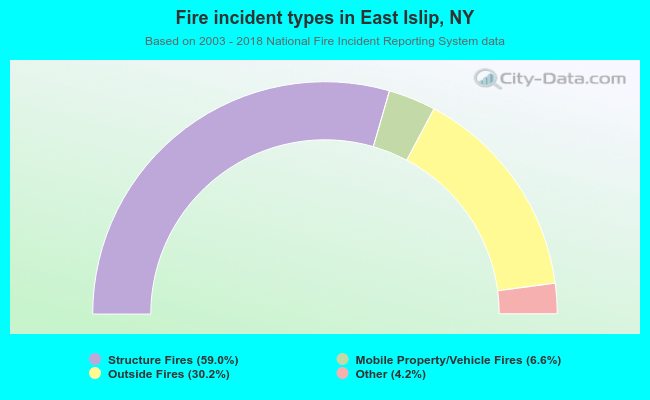 When looking into fire subcategories, the most incidents belonged to: Structure Fires (59.0%), and Outside Fires (30.2%).