East Carondelet: Fire Incidents, Illinois (IL)
Where are fire incidents reported in East Carondelet, IL
Something went wrong! Please refresh the page.
|
| |||||||||||||||||||||||||||||||||||||||||||||||||||||||||||||||||||||||||||||||||||||||||||||||||||||||||||||
2002 - 2018 National Fire Incident Reporting System (NFIRS) incidents
- Incident types reported to NFIRS in East Carondelet, IL
- 18857.0%Fire
- 7422.4%Rescue & EMS
- 3911.8%Hazardous Condition
- 216.4%Good Intent Call
- 41.2%Service Call
- 41.2%False Alarm
- Fire incident types reported to NFIRS in East Carondelet, IL
- 9248.9%Structure Fires
- 7942.0%Outside Fires
- 158.0%Mobile Property/Vehicle Fires
- 21.1%Other
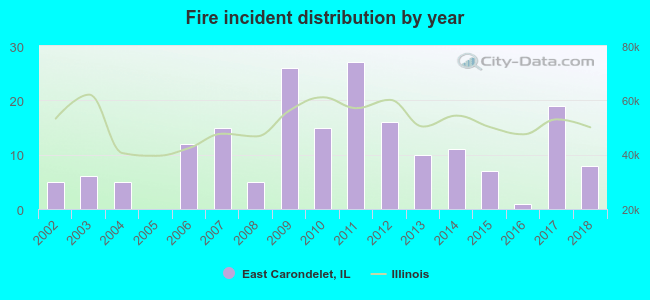 According to the data from the years 2002 - 2018 the average number of fires per year is 11. The highest number of fire incidents - 27 took place in 2011, and the least - 0 in 2005. The data has a growing trend.
 28.7% incidents where reported in the morning and 71.3% in the evening. The most fires (19.1%) took place on Sunday, and the least (9.0%) on Wednesday.
 According to the 188 fire incidents from years 2002 - 2018 most fires (19.7%) took place during February, and the least (3.2%) in June.
 Out of all 330 cases reported during the years 2002 - 2018, the most belonged to the categories: Fire (57.0%), Overpressure Rupture (22.4%), and Rescue & EMS (11.8%).
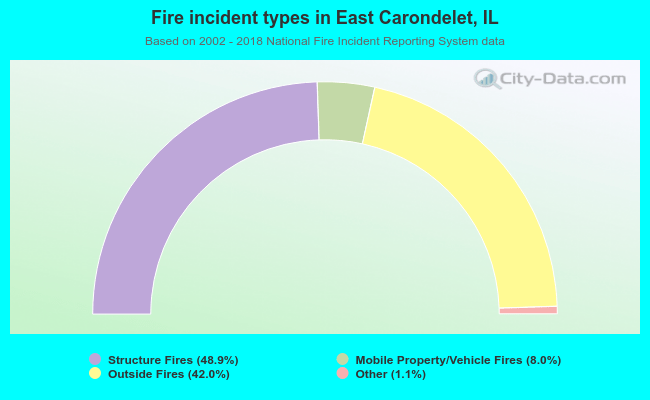 When looking into fire subcategories, the most reports belonged to: Structure Fires (48.9%), and Outside Fires (42.0%).