East Bernard: Fire Incidents, Texas (TX)
Where are fire incidents reported in East Bernard, TX
Something went wrong! Please refresh the page.
|
| |||||||||||||||||||||||||||||||||||||||||||||||||||||||||||||||||||||||||||||||||||||||||||||||||||||||||||||
2002 - 2018 National Fire Incident Reporting System (NFIRS) incidents
- Incident types reported to NFIRS in East Bernard, TX
- 15740.6%Fire
- 10827.9%Rescue & EMS
- 6216.0%Good Intent Call
- 328.3%Hazardous Condition
- 133.4%Service Call
- 133.4%False Alarm
- 10.3%Overpressure Rupture
- 10.3%Severe Weather
- Fire incident types reported to NFIRS in East Bernard, TX
- 10566.9%Outside Fires
- 3119.7%Structure Fires
- 1710.8%Mobile Property/Vehicle Fires
- 42.5%Other
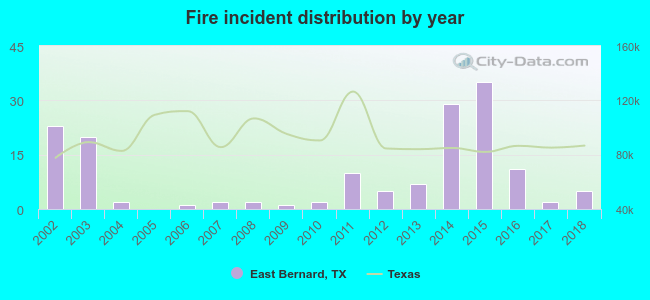 Based on the data from the years 2002 - 2018 the average number of fire incidents per year is 9. The highest number of fires - 35 took place in 2015, and the least - 0 in 2005. The data has a dropping trend.
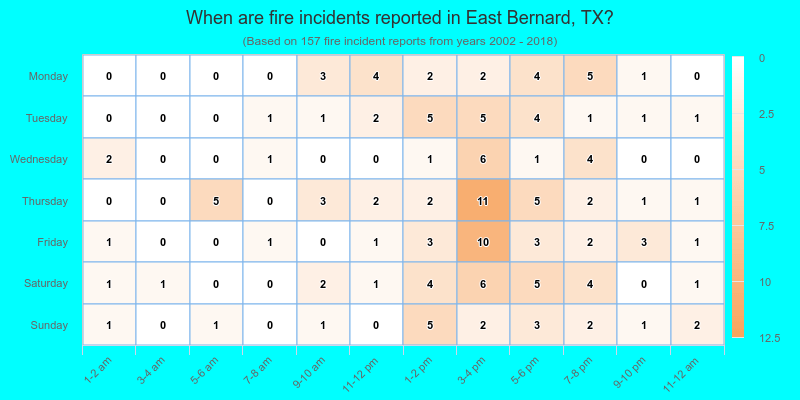
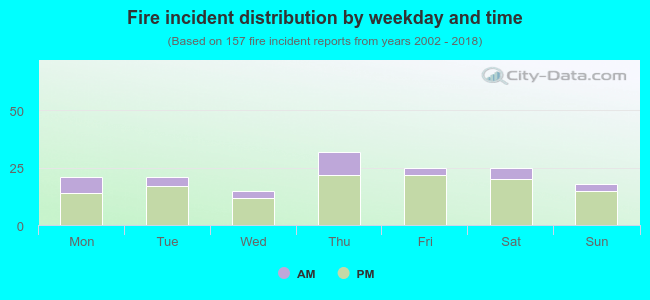 22.3% incidents where reported in the morning and 77.7% in the evening. The most fires (20.4%) took place on Thursday, and the least (9.6%) on Wednesday.
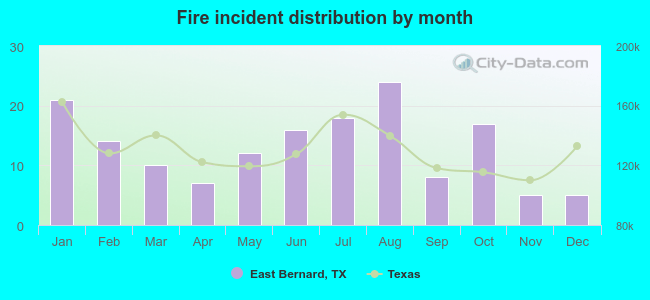 Based on the 157 fires from years 2002 - 2018 most fires (15.3%) took place during August, and the least (3.2%) in November.
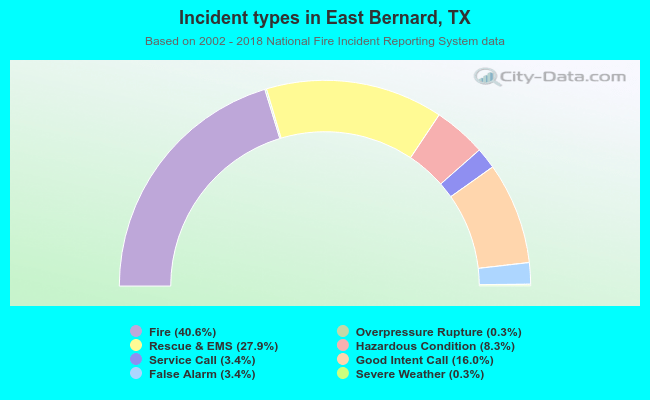 Out of all 387 cases reported during the years 2002 - 2018, the most belonged to the categories: Fire (40.6%), Rescue & EMS (27.9%), and Good Intent Call (16.0%).
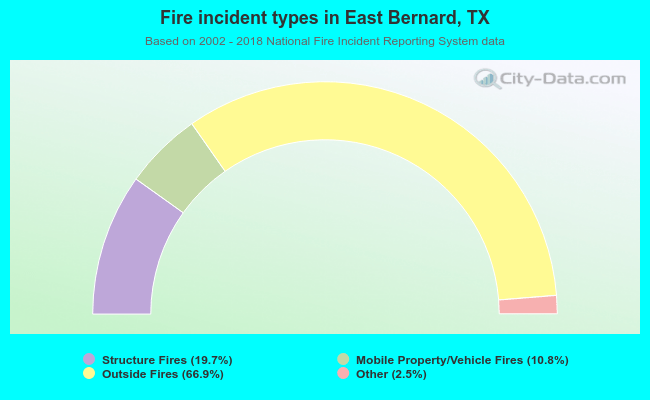 When looking into fire subcategories, the most reports belonged to: Outside Fires (66.9%), and Structure Fires (19.7%).