Dyersville: Fire Incidents, Iowa (IA)
Where are fire incidents reported in Dyersville, IA
Something went wrong! Please refresh the page.
|
| |||||||||||||||||||||||||||||||||||||||||||||||||||||||||||||||||||||||||||||||||||||||||||||||||||||||||||||
2002 - 2018 National Fire Incident Reporting System (NFIRS) incidents
- Incident types reported to NFIRS in Dyersville, IA
- 27044.8%Fire
- 14624.2%Hazardous Condition
- 6911.4%Rescue & EMS
- 345.6%Good Intent Call
- 294.8%Service Call
- 244.0%Severe Weather
- 233.8%False Alarm
- 71.2%Special Incident
- 10.2%Overpressure Rupture
- Fire incident types reported to NFIRS in Dyersville, IA
- 12245.2%Outside Fires
- 8732.2%Structure Fires
- 4918.1%Mobile Property/Vehicle Fires
- 124.4%Other
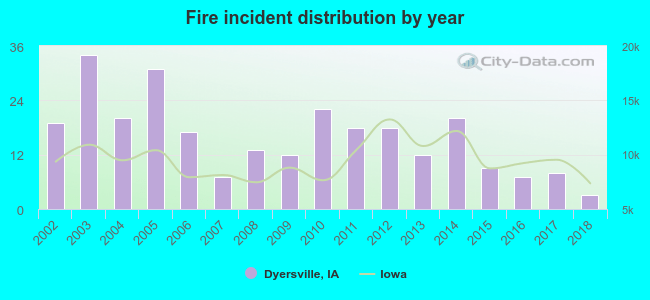 According to the data from the years 2002 - 2018 the average number of fires per year is 16. The highest number of fires - 34 took place in 2003, and the least - 3 in 2018. The data has a dropping trend.
 29.6% incidents where reported in the morning and 70.4% in the evening. The most fires (18.1%) took place on Thursday, and the least (10.0%) on Friday.
 According to the 270 fire incident reports from years 2002 - 2018 most fires (14.4%) took place during April, and the least (3.3%) in January.
 Out of all 603 cases reported during the years 2002 - 2018, the most belonged to the categories: Fire (44.8%), Hazardous Condition (24.2%), and Rescue & EMS (11.4%).
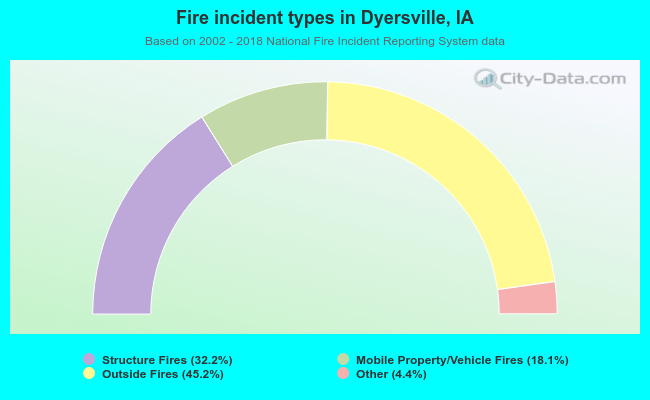 When looking into fire subcategories, the most reports belonged to: Outside Fires (45.2%), and Structure Fires (32.2%).