| Fire incidents reported |
|---|
| Sreet name | Count |
|---|
| HWY 85 | 8 | | 650TH ST | 6 | | COUNTY ROAD D HWY | 6 | | HAYES RD RD | 6 | | HIGHWAY 25 HWY | 6 | | MENOMONIE FIRE | 6 | | MONTGOMERY ST | 6 | | 7TH AVENUE EAST | 4 | | COUNTY RD B | 4 | | COUNTY RD V | 4 | | COUNTY ROAD FF | 4 | | COUNTY ROAD P HWY | 4 | | COUNTY ROAD R HWY | 4 | | COUNTY ROAD SS HWY | 4 | | CTY RD V | 4 | | HAYES RD | 4 | | HIGHWAY 25 NORTH HWY | 4 | | HIGHWAY 25 SOUTH HWY | 4 | | HIGHWAY 85 | 4 | | L POESCHEL ROAD | 4 | | MADISON ST | 4 | | PROSPECT STREET ST | 4 | | SOUTH PRAIRIE | 4 | | U S HIGHWAY 10 EAST HWY | 4 | | US HIGHWAY 10 | 4 |
| | | Fire incidents reported |
|---|
| Sreet name | Count |
|---|
| WELLS ST | 4 | | 11 TH AVE AVE | 2 | | 160TH STR | 2 | | 1ST AVE AVE | 2 | | 290TH STREET ST | 2 | | 330TH AVE | 2 | | 37TH AVE AVE | 2 | | 3RD AVENUE EAST AVE | 2 | | 4TH AVENUE EAST | 2 | | 50 AVE | 2 | | 50TH AVENUE AVE | 2 | | 5356 US HWY 10 | 2 | | 55 CTY RD AA | 2 | | 570TH | 2 | | 5TH AVENUE WEST | 2 | | 660TH AVE | 2 | | 7TH AVE | 2 | | 8TH AVENUE WEST AVE | 2 | | 90 TH AVE | 2 | | 960TH AVE | 2 | | ALBANY A RD | 2 | | ALBANY C RD | 2 | | BOYD SPRINGS ROAD RDS | 2 | | BRION ROAD RD | 2 | | |
|
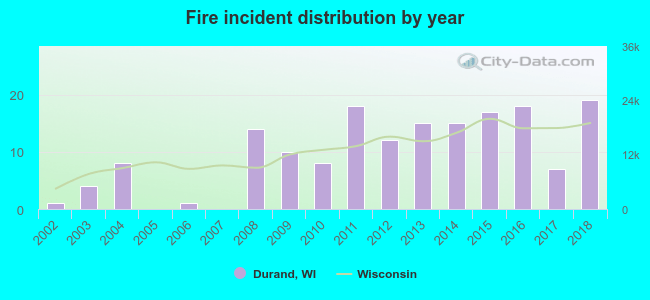 Based on the data from the years 2002 - 2018 the average number of fires per year is 10. The highest number of fires - 19 took place in 2018, and the least - 0 in 2005. The data has a growing trend.
 37.1% incidents where reported in the morning and 62.9% in the evening. The most fires (25.1%) took place on Monday, and the least (9.6%) on Tuesday.
 Based on the 167 incident reports from years 2002 - 2018 most fires (13.8%) took place during April, and the least (1.8%) in December.
 Out of all 353 cases reported during the years 2002 - 2018, the most belonged to the categories: Fire (47.3%), Overpressure Rupture (21.5%), and Rescue & EMS (19.0%).
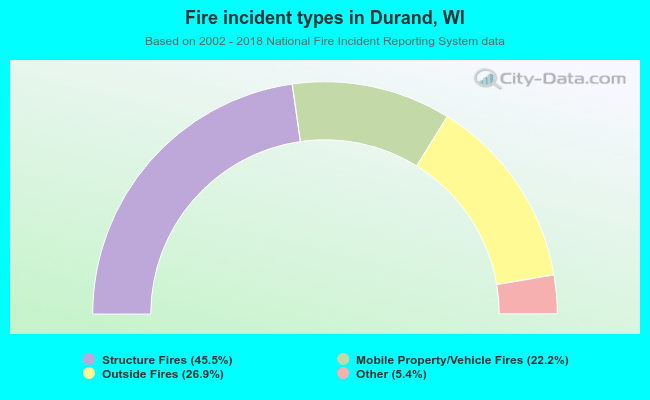 When looking into fire subcategories, the most incidents belonged to: Structure Fires (45.5%), and Outside Fires (26.9%).