| Fire incidents reported |
|---|
| Sreet name | Count |
|---|
| LEGION HALL RD | 24 | | ALTA LN | 20 | | CEDAR HILLS DR | 20 | | PARKS SCHOOL RD | 20 | | SINGING WOODS RD | 20 | | RT 40 | 18 | | I74 | 14 | | KOERNER RD | 14 | | ROUTE 91 RT | 14 | | FOURTH ST | 12 | | 91 RT | 10 | | BLAND RD | 10 | | SALEM SCHOOL RD | 10 | | BRIMFIELD JUBILEE RD | 8 | | EVANS MILL RD | 8 | | GRANGE HALL RD | 8 | | MEADOWLARK LN | 8 | | TRIGGER RD | 8 | | WOODSIDE DR | 8 | | BRENTFIELD DR | 6 | | CLINE RD | 6 | | DICKISON CEMETERY RD | 6 | | FIRST ST | 6 | | HICKORY GROVE RD | 6 | | RADNOR RD | 6 |
| | | Fire incidents reported |
|---|
| Sreet name | Count |
|---|
| ROUTE 91 | 6 | | TIMBERDALE DR | 6 | | BENNETT CT | 4 | | BLACKSOIL LN | 4 | | BRISTOL HOLLOW RD | 4 | | CENTERVILLE RD | 4 | | CLUB RD | 4 | | DUGGINS RD | 4 | | GARDEN LN | 4 | | HICKS HOLLOW RD | 4 | | KICKAPOOEDWARDS RD | 4 | | PAULI | 4 | | PRINCEVILLE JUBILEE RD | 4 | | PROSPECT RD | 4 | | ROUTE 40 RT | 4 | | RT 91 RT | 4 | | SANTA FE | 4 | | SHADETREE DR | 4 | | SOUTHPORT RD | 4 | | WALNUT AVE | 4 | | WILLOW KNOLLS CT | 4 | | WONDERVIEW DR | 4 | | 1ST ST | 2 | | 303 N. FOURTH ST. | 2 | | |
|
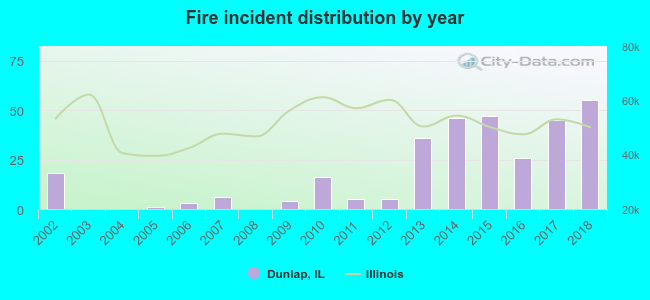 According to the data from the years 2002 - 2018 the average number of fires per year is 18. The highest number of reported fire incidents - 55 took place in 2018, and the least - 0 in 2003. The data has a rising trend.
 25.2% incidents where reported in the morning and 74.8% in the evening. The most fires (16.6%) took place on Monday, and the least (13.1%) on Thursday.
 Based on the 313 incident reports from years 2002 - 2018 most fires (15.3%) took place during March, and the least (4.8%) in January.
 Out of all 1,748 cases reported during the years 2002 - 2018, the most belonged to the categories: Rescue & EMS (47.1%), Fire (17.9%), and Good Intent Call (16.9%).
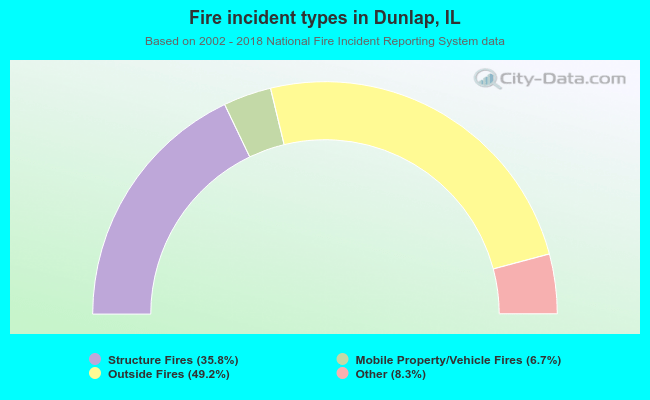 When looking into fire subcategories, the most reports belonged to: Outside Fires (49.2%), and Structure Fires (35.8%).