| Fire incidents reported |
|---|
| Sreet name | Count |
|---|
| PECHIN RD | 12 | | UNIVERSITY DR | 10 | | DUNBAR RD | 6 | | HARDY HILL RD | 6 | | MAHONING RD | 6 | | OAK ST | 6 | | 5TH ST | 4 | | CHURCH HILL RD | 4 | | CONNELLSVILLE ST | 4 | | CRAWFORD AVE | 4 | | FAYETTE ST | 4 | | FERGUSON RD | 4 | | GOUKER RD | 4 | | ICMI RD | 4 | | JUNIATA ST | 4 | | MORRELL RD | 4 | | STONEY RD | 4 | | WOODVALE ST | 4 | | 1 SHORT ST | 2 | | 101 STONEY RD | 2 | | 1046 BROADWAY ST. | 2 | | 106 GOUKER ROAD | 2 | | 11 COUNTRY RD | 2 | | 1306 CONCORD DR | 2 | | 132 CONNELLSVILLE ST. | 2 |
| | | Fire incidents reported |
|---|
| Sreet name | Count |
|---|
| 1353 CONNELLSVILLE RD | 2 | | 137 GREEN ST | 2 | | 146 OLD BRADDOCK RD | 2 | | 151 DUNBAR OHIOPYLE RD | 2 | | 165 PERCY RD | 2 | | 17 HINSEY ST | 2 | | 170 MEMORY LANE | 2 | | 170 OGLEVEE LANE | 2 | | 20 INDEPENDENT STREET | 2 | | 347 BANK ST | 2 | | 37 2ND STREET | 2 | | 455 JEFFERSON ST | 2 | | 534 HIGH STREET | 2 | | 72 E RAILROAD ST | 2 | | 801 RIVERSIDE DR | 2 | | AIRPORT RD | 2 | | ALPINE LANE | 2 | | ALPINE LN | 2 | | ARCH BRIDGE RD | 2 | | BITNER RD | 2 | | BITNER ROAD | 2 | | BOLOBIAN RD. | 2 | | BROADWAY ST | 2 | | CAMBRIA ST | 2 | | |
|
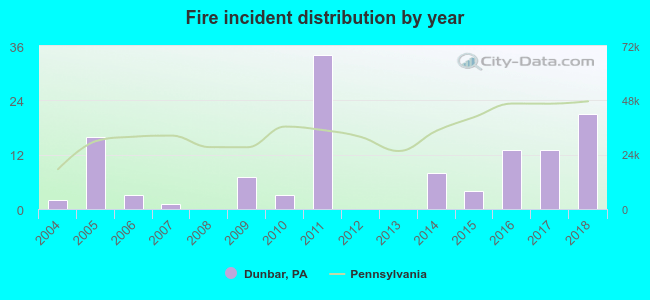 Based on the data from the years 2004 - 2018 the average number of fire incidents per year is 8. The highest number of reported fire incidents - 34 took place in 2011, and the least - 0 in 2008. The data has an increasing trend.
 36.8% incidents where reported in the morning and 63.2% in the evening. The most fires (20.8%) took place on Sunday, and the least (10.4%) on Wednesday.
 Based on the 125 fire incidents from years 2004 - 2018 most fires (15.2%) took place during March, and the least (4.0%) in August.
 Out of all 344 cases reported during the years 2004 - 2018, the most belonged to the categories: Fire (36.3%), Overpressure Rupture (33.4%), and Rescue & EMS (9.6%).
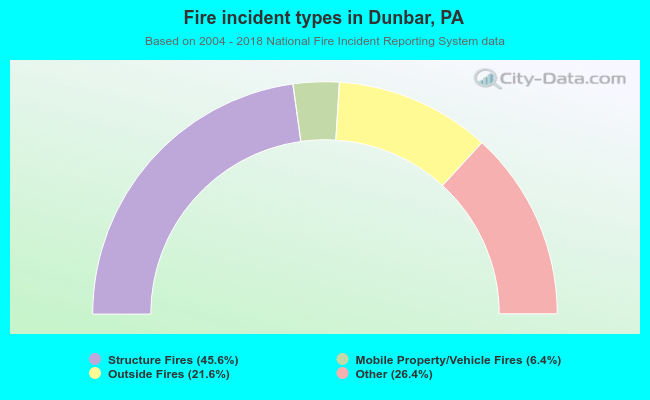 When looking into fire subcategories, the most reports belonged to: Structure Fires (45.6%), and Other (26.4%).