Dumas: Fire Incidents, Texas (TX)
Where are fire incidents reported in Dumas, TX
Something went wrong! Please refresh the page.
| Fire incidents reported | |
|---|---|
| Sreet name | Count |
| US 287 | 24 |
| DUMAS AVE | 22 |
| MEREDITH AVE | 22 |
| 2203 | 16 |
| 2ND ST | 12 |
| HWY 119 | 12 |
| HWY 152 EAST | 12 |
| HWY 1913 | 12 |
| HWY 287 SOUTH | 12 |
| MADDOX AVE | 12 |
| 19TH ST | 10 |
| FM 722 | 10 |
| MCCLARY ROAD RD | 10 |
| ZAUK AVE | 10 |
| 1ST | 8 |
| 1ST ST | 8 |
| 281 | 8 |
| CHELSEA AVE | 8 |
| GUYLANE PLAZA | 8 |
| HWY 287 | 8 |
| OAK AVE | 8 |
| 14 MILES SOUTH 287 | 6 |
| 14TH | 6 |
| 287 HWY | 6 |
| 315 E. 19TH | 6 |
| 7TH ST | 6 |
| 87 WEST | 6 |
| 8TH ST | 6 |
| BEARD AVE | 6 |
| BENNETT | 6 |
| Other | 1,119 |
2002 - 2018 National Fire Incident Reporting System (NFIRS) incidents
- Incident types reported to NFIRS in Dumas, TX
- 3,60653.0%Rescue & EMS
- 1,42520.9%Fire
- 92913.7%Hazardous Condition
- 3895.7%Good Intent Call
- 2734.0%False Alarm
- 1532.2%Service Call
- 130.2%Overpressure Rupture
- 120.2%Special Incident
- Fire incident types reported to NFIRS in Dumas, TX
- 88462.0%Outside Fires
- 29420.6%Structure Fires
- 20014.0%Mobile Property/Vehicle Fires
- 473.3%Other
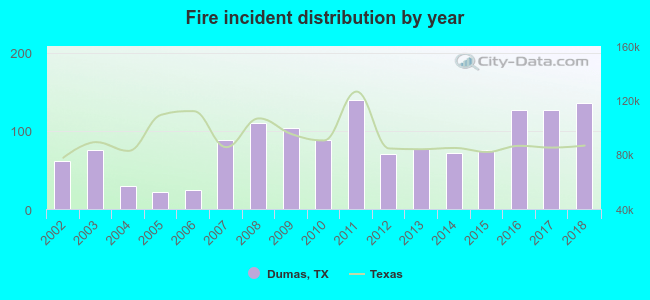 According to the data from the years 2002 - 2018 the average number of fire incidents per year is 84. The highest number of reported fires - 139 took place in 2011, and the least - 22 in 2005. The data has an increasing trend.
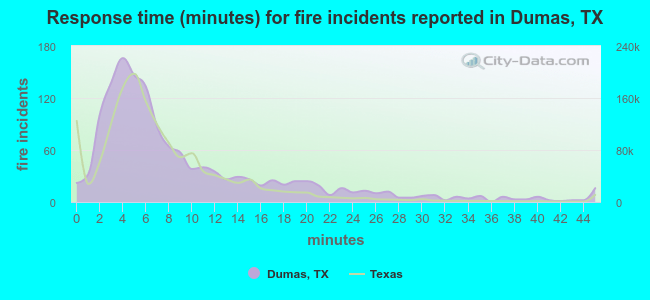 The median response time based on all reported fire incidents is 6 minutes. This is about the same as the state median value.
The median response time in Dumas, TX compared to nearest cities:
(Note: Based on data for all years, including only cities with at least 500 fire incidents)
| Dumas: | 6 minutes |
| Fritch: | 8 minutes |
| Dalhart: | 10 minutes |
| Borger: | 5 minutes |
| Amarillo: | 5 minutes |
| Panhandle: | 14 minutes |
| Spearman: | 10 minutes |
| Pampa: | 4 minutes |
| Canyon: | 9 minutes |
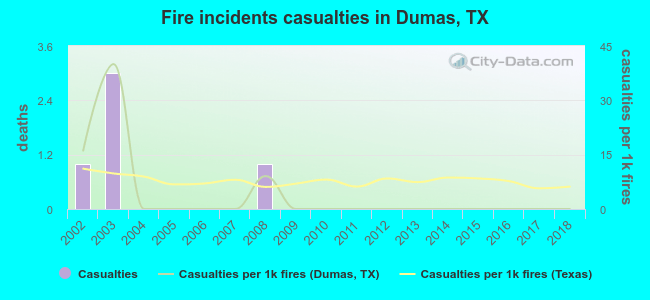 Based on the data from the years 2002 - 2018 the average number of fire-related yearly casualties is 0. The highest number of reported casualties - 3 took place in 2003, and the lowest - 0 in 2004. The data has a dropping trend.
The average number of injuries per 1,000 fires is 4. This indicator was the highest - 40 in 2003, and the lowest 0 in 2004. The trend for injuries per 1,000 incidents is declining. Compared to the state value the number of casualties per 1,000 fire incidents is much lower.
Based on the data from the years 2002 - 2018 the average number of fire-related yearly casualties is 0. The highest number of reported casualties - 3 took place in 2003, and the lowest - 0 in 2004. The data has a dropping trend.
The average number of injuries per 1,000 fires is 4. This indicator was the highest - 40 in 2003, and the lowest 0 in 2004. The trend for injuries per 1,000 incidents is declining. Compared to the state value the number of casualties per 1,000 fire incidents is much lower.
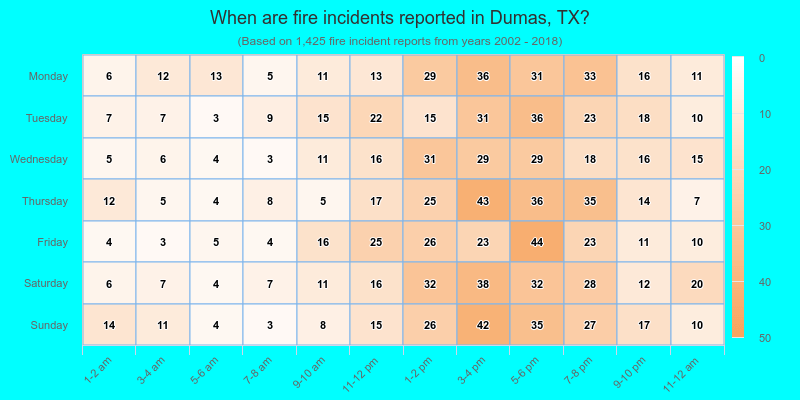
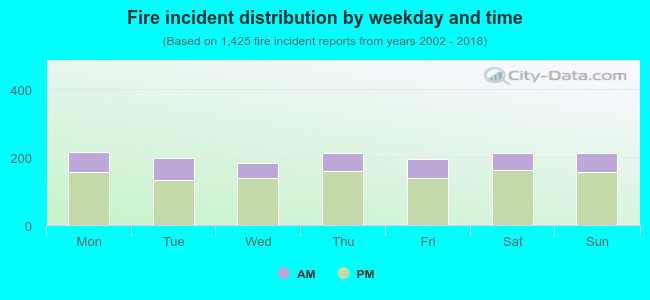 26.8% incidents where reported in the morning and 73.2% in the evening. The most fires (15.2%) took place on Monday, and the least (12.8%) on Wednesday.
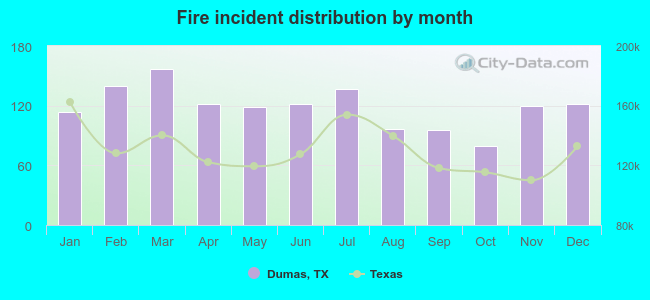 Based on the 1,425 incident reports from years 2002 - 2018 most fires (11.0%) took place during March, and the least (5.5%) in October.
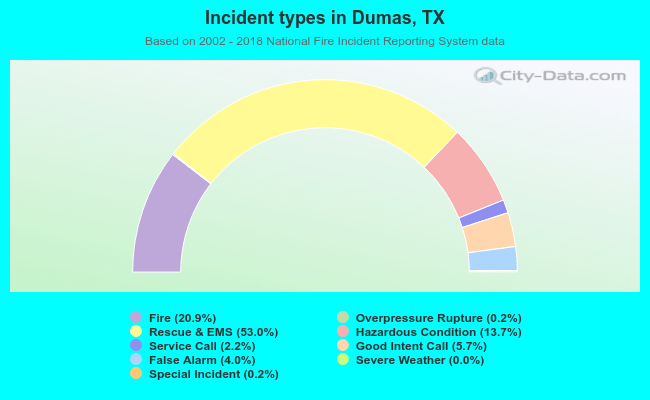 Out of all 6,803 cases reported during the years 2002 - 2018, the most belonged to the categories: Rescue & EMS (53.0%), Fire (20.9%), and Hazardous Condition (13.7%).
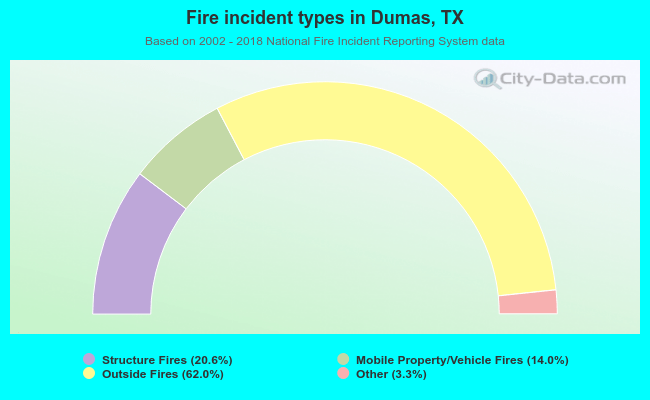 When looking into fire subcategories, the most reports belonged to: Outside Fires (62.0%), and Structure Fires (20.6%).