Dimondale: Fire Incidents, Michigan (MI)
Where are fire incidents reported in Dimondale, MI
Something went wrong! Please refresh the page.
|
| |||||||||||||||||||||||||||||||||||||||||||||||||||||||||||||||||||||||||||||||||||||||||||||||||||||||||||||
2002 - 2018 National Fire Incident Reporting System (NFIRS) incidents
- Incident types reported to NFIRS in Dimondale, MI
- 40330.7%Fire
- 30323.1%Rescue & EMS
- 25619.5%Hazardous Condition
- 14310.9%Good Intent Call
- 1047.9%False Alarm
- 937.1%Service Call
- 50.4%Severe Weather
- 50.4%Special Incident
- Fire incident types reported to NFIRS in Dimondale, MI
- 15839.2%Structure Fires
- 11428.3%Mobile Property/Vehicle Fires
- 11227.8%Outside Fires
- 194.7%Other
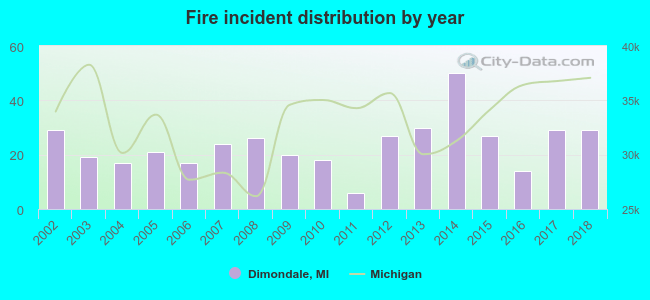 Based on the data from the years 2002 - 2018 the average number of fires per year is 24. The highest number of fires - 50 took place in 2014, and the least - 6 in 2011. The data has a constant trend.
 Based on the data from the years 2002 - 2018 the average number of fire-related casualties per year is 0. The highest number of reported casualties - 3 took place in 2002, and the lowest - 0 in 2004. The data has a declining trend.
 35.0% incidents where reported in the morning and 65.0% in the evening. The most fires (21.8%) took place on Sunday, and the least (10.2%) on Friday.
 According to the 403 fire incidents from years 2002 - 2018 most fires (13.6%) took place during March, and the least (4.7%) in November.
 Out of all 1,313 cases reported during the years 2002 - 2018, the most belonged to the categories: Fire (30.7%), Rescue & EMS (23.1%), and Hazardous Condition (19.5%).
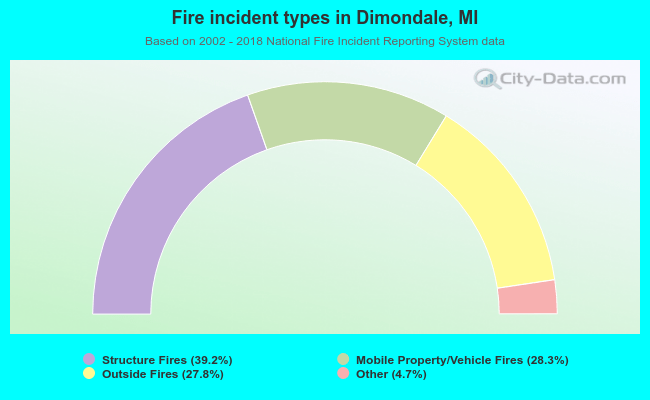 When looking into fire subcategories, the most incidents belonged to: Structure Fires (39.2%), and Mobile Property/Vehicle Fires (28.3%).