| Fire incidents reported |
|---|
| Sreet name | Count |
|---|
| 1100TH AVE | 6 | | 200TH AVE | 6 | | 100TH AVE | 4 | | 104 W CENTER | 4 | | 1600TH ST | 4 | | 1600TH ST | 4 | | 1900TH ST | 4 | | 19139 E 600TH AVE | 4 | | 19139E 600TH AVE | 4 | | 2100TH ST | 4 | | 4365 N 2200TH ST | 4 | | 600TH AVE | 4 | | MAIN | 4 | | 250 | 2 | | 400TH AVE | 2 | | 1/2M N 400 ON 2000 | 2 | | 1/4 M E RT 33 ON 2100 | 2 | | 100 ZUMBAHLEN | 2 | | 100 ZUMBAHLEN AVE | 2 | | 1000TH AVE | 2 | | 100TH AVE 1/2M E OF 2300TH | 2 | | 103 S PINE | 2 | | 104 LODA ST | 2 | | 10448 N 2100TH ST | 2 | | 1100 TH AVE. | 2 |
| | | Fire incidents reported |
|---|
| Sreet name | Count |
|---|
| 1200TH AVE | 2 | | 14727 N 200TH ST | 2 | | 1500TH ST | 2 | | 1500TH ST 300TH AVE | 2 | | 1500TH ST. | 2 | | 1516 N 1900TH ST | 2 | | 1516N 1900TH ST | 2 | | 15810 N 400TH ST | 2 | | 1600TH ST. | 2 | | 1600TH STREET E 400TH AVE | 2 | | 1626 E 400TH AVE | 2 | | 16264 E 400TH AVE | 2 | | 16551 E 200TH AVE | 2 | | 1700TH ST | 2 | | 1700TH ST. | 2 | | 1750TH ST | 2 | | 1800TH ST | 2 | | 18833E 400TH AVE | 2 | | 1900TH ST 700TH AVE | 2 | | 1900TH STREET AT 350TH AVE | 2 | | 19065 E 900TH AVE | 2 | | 1910E 1100TH AVE | 2 | | 19394 E 300TH | 2 | | 19417 E 600TH AVE | 2 | | |
|
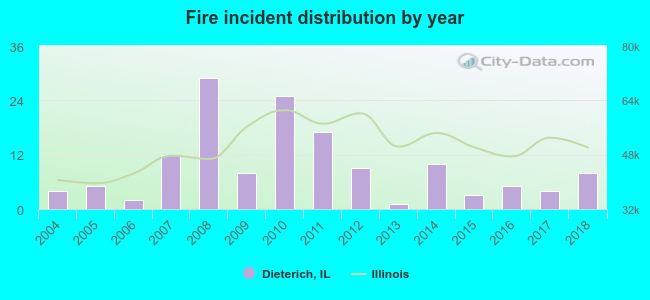 Based on the data from the years 2004 - 2018 the average number of fires per year is 9. The highest number of reported fire incidents - 29 took place in 2008, and the least - 1 in 2013. The data has a rising trend.
 35.9% incidents where reported in the morning and 64.1% in the evening. The most fires (19.7%) took place on Wednesday, and the least (8.5%) on Monday.
 Based on the 142 incident reports from years 2004 - 2018 most fires (16.2%) took place during February, and the least (4.2%) in May.
 Out of all 530 cases reported during the years 2004 - 2018, the most belonged to the categories: Overpressure Rupture (52.8%), Fire (26.8%), and Rescue & EMS (8.3%).
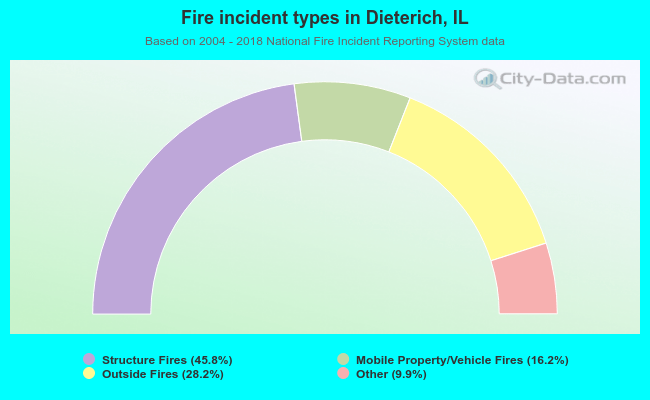 When looking into fire subcategories, the most incidents belonged to: Structure Fires (45.8%), and Outside Fires (28.2%).