| Fire incidents reported |
|---|
| Sreet name | Count |
|---|
| 306 HWY | 20 | | CYPRESS DR | 18 | | HWY 90 HWY | 18 | | HWY 90 WEST | 18 | | US90 | 18 | | HWY 632WPA CURVE HWY | 16 | | MARK DR | 16 | | CROCHET LN | 14 | | HWY 631OLDROAD HWY | 14 | | HWY 90 EAST HWY | 14 | | HWY 90 WEST BOUND HWY | 14 | | MATHERNE DR | 12 | | MOTT ST | 12 | | FOLSE RD | 10 | | FOLSE ST | 10 | | LA 631DESALLEMANDS HWY | 10 | | OLD SPANISH TRAIL TRL | 10 | | US 90 | 10 | | GRAND BAYOU RD | 8 | | HWY 631 | 8 | | LORRAINE DR | 8 | | MATTHEW DR | 8 | | 90 HWY | 6 | | CYPRESS POINT | 6 | | EASY ST | 6 |
| | | Fire incidents reported |
|---|
| Sreet name | Count |
|---|
| FARRELL LN | 6 | | HWY 631 RD | 6 | | HWY 631OLD SPANISH TR HWY | 6 | | HWY 90 EAST BOUND HWY | 6 | | HWY 90 WEST HWY | 6 | | KLINER RD | 6 | | LEVEE RD | 6 | | RAILROAD AVE | 6 | | RIDGE RD | 6 | | TWIN BRIDGE RD | 6 | | UP THE BAYOU RD | 6 | | US HWY 90 EAST HWY | 6 | | WPA RD | 6 | | BAYOU DES ALLEMANDS BY | 4 | | BAYOU GAUCHE RD HWY 306 HWY | 4 | | BEAU PL | 4 | | BORAS | 4 | | DUFRENE TRAILER PARK PRV | 4 | | FIRST ST | 4 | | FONDA | 4 | | HIGHWAY 631 | 4 | | HWY 306 | 4 | | HWY 631 HWY | 4 | | HWY 631 HWY 635 HWY | 4 | | |
|
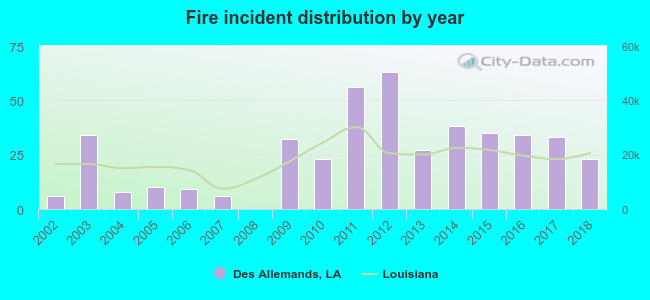 According to the data from the years 2002 - 2018 the average number of fires per year is 26. The highest number of reported fire incidents - 63 took place in 2012, and the least - 0 in 2008. The data has an increasing trend.
 27.0% incidents where reported in the morning and 73.0% in the evening. The most fires (17.2%) took place on Monday, and the least (12.1%) on Thursday.
 Based on the 437 incident reports from years 2002 - 2018 most fires (17.6%) took place during January, and the least (4.3%) in April.
 Out of all 969 cases reported during the years 2002 - 2018, the most belonged to the categories: Fire (45.1%), Rescue & EMS (21.9%), and Hazardous Condition (15.6%).
 When looking into fire subcategories, the most reports belonged to: Outside Fires (57.7%), and Structure Fires (27.9%).