Deadwood: Fire Incidents, South Dakota (SD)
Where are fire incidents reported in Deadwood, SD
Something went wrong! Please refresh the page.
|
| |||||||||||||||||||||||||||||||||||||||||||||||||||||||||||||||||||||||||||||||||||||||||||||||||||||||||||||
2002 - 2018 National Fire Incident Reporting System (NFIRS) incidents
- Incident types reported to NFIRS in Deadwood, SD
- 30727.8%Hazardous Condition
- 24722.4%False Alarm
- 23321.1%Fire
- 13612.3%Service Call
- 787.1%Good Intent Call
- 726.5%Rescue & EMS
- 121.1%Severe Weather
- 100.9%Overpressure Rupture
- 100.9%Special Incident
- Fire incident types reported to NFIRS in Deadwood, SD
- 9842.1%Outside Fires
- 7030.0%Structure Fires
- 4619.7%Mobile Property/Vehicle Fires
- 198.2%Other
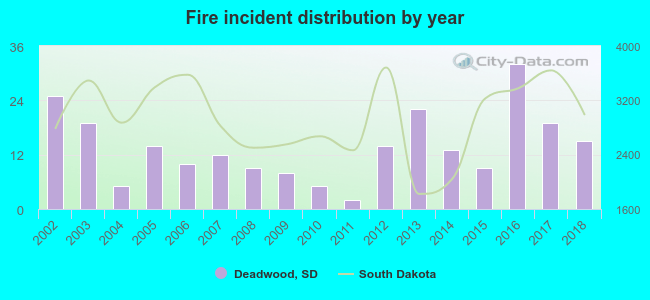 According to the data from the years 2002 - 2018 the average number of fire incidents per year is 14. The highest number of reported fires - 32 took place in 2016, and the least - 2 in 2011. The data has a decreasing trend.
 According to the data from the years 2002 - 2018 the average number of fire-related casualties per year is 0. The highest number of reported casualties - 4 took place in 2002, and the lowest - 0 in 2004. The data has a decreasing trend.
 31.8% incidents where reported in the morning and 68.2% in the evening. The most fires (21.9%) took place on Saturday, and the least (10.3%) on Wednesday.
 Based on the 233 incident reports from years 2002 - 2018 most fires (15.0%) took place during July, and the least (3.9%) in February.
 Out of all 1,105 cases reported during the years 2002 - 2018, the most belonged to the categories: Hazardous Condition (27.8%), False Alarm (22.4%), and Fire (21.1%).
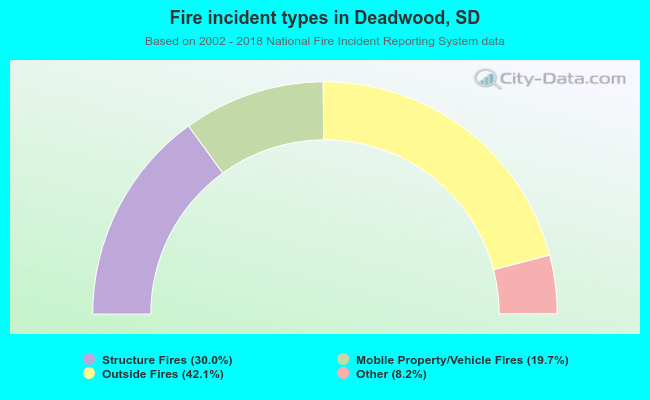 When looking into fire subcategories, the most incidents belonged to: Outside Fires (42.1%), and Structure Fires (30.0%).