Daytona Beach Shores: Fire Incidents, Florida (FL)
Where are fire incidents reported in Daytona Beach Shores, FL
Something went wrong! Please refresh the page.
|
| |||||||||||||||||||||||||||||||||||||||||||||||||||||||||||||||||||||||||||||||||||||||||||||||||||||||||||||
2004 - 2018 National Fire Incident Reporting System (NFIRS) incidents
- Incident types reported to NFIRS in Daytona Beach Shores, FL
- 3,81649.4%Rescue & EMS
- 1,34917.5%Good Intent Call
- 94612.2%Service Call
- 6898.9%False Alarm
- 5707.4%Hazardous Condition
- 3514.5%Fire
- Fire incident types reported to NFIRS in Daytona Beach Shores, FL
- 15343.6%Structure Fires
- 12635.9%Outside Fires
- 4011.4%Other
- 329.1%Mobile Property/Vehicle Fires
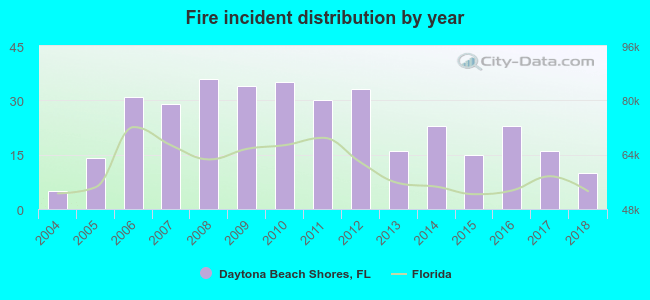 According to the data from the years 2004 - 2018 the average number of fire incidents per year is 23. The highest number of reported fire incidents - 36 took place in 2008, and the least - 5 in 2004. The data has an increasing trend.
 Based on the data from the years 2004 - 2018 the average number of fire-related yearly casualties is 0. The highest number of casualties - 2 took place in 2013, and the lowest - 0 in 2004. The data has a constant trend.
 28.2% incidents where reported in the morning and 71.8% in the evening. The most fires (16.5%) took place on Tuesday, and the least (12.5%) on Wednesday.
 Based on the 351 incident reports from years 2004 - 2018 most fires (12.5%) took place during May, and the least (4.3%) in October.
 Out of all 7,730 cases reported during the years 2004 - 2018, the most belonged to the categories: Rescue & EMS (49.4%), Good Intent Call (17.5%), and Service Call (12.2%).
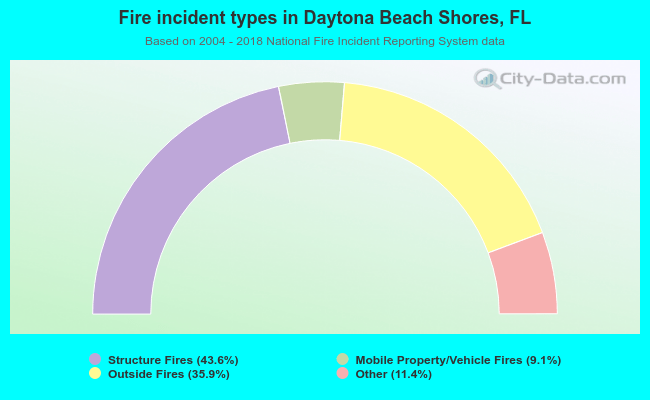 When looking into fire subcategories, the most reports belonged to: Structure Fires (43.6%), and Outside Fires (35.9%).