Dawson Springs: Fire Incidents, Kentucky (KY)
Where are fire incidents reported in Dawson Springs, KY
Something went wrong! Please refresh the page.
|
| |||||||||||||||||||||||||||||||||||||||||||||||||||||||||||||||||||||||||||||||||||||||||||||||||||||||||||||
| Other | 69 | |||||||||||||||||||||||||||||||||||||||||||||||||||||||||||||||||||||||||||||||||||||||||||||||||||||||||||||
2002 - 2018 National Fire Incident Reporting System (NFIRS) incidents
- Incident types reported to NFIRS in Dawson Springs, KY
- 40757.0%Fire
- 17023.8%Rescue & EMS
- 7510.5%Hazardous Condition
- 375.2%Good Intent Call
- 162.2%False Alarm
- 91.3%Service Call
- Fire incident types reported to NFIRS in Dawson Springs, KY
- 18144.5%Structure Fires
- 15337.6%Outside Fires
- 5413.3%Mobile Property/Vehicle Fires
- 194.7%Other
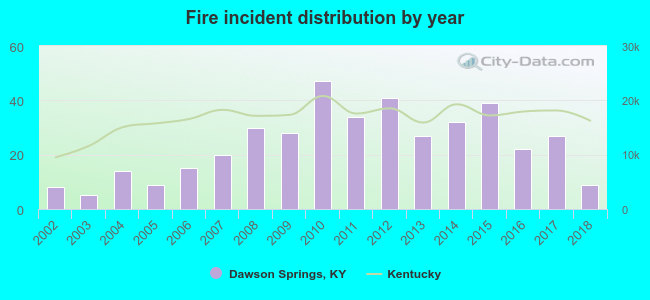 According to the data from the years 2002 - 2018 the average number of fire incidents per year is 24. The highest number of fire incidents - 47 took place in 2010, and the least - 5 in 2003. The data has a rising trend.
 Based on the data from the years 2002 - 2018 the average number of fire-related fatalities per year is 0. The highest number of deaths - 2 took place in 2003, and the lowest - 0 in 2002. The data has a constant trend.
 According to the data from the years 2002 - 2018 the average number of fire-related casualties per year is 1. The highest number of reported injuries - 5 took place in 2010, and the lowest - 0 in 2003. The data has a decreasing trend.
 30.7% incidents where reported in the morning and 69.3% in the evening. The most fires (16.0%) took place on Saturday, and the least (11.3%) on Thursday.
 According to the 407 incident reports from years 2002 - 2018 most fires (14.3%) took place during March, and the least (4.7%) in May.
 Out of all 714 cases reported during the years 2002 - 2018, the most belonged to the categories: Fire (57.0%), Overpressure Rupture (23.8%), and Rescue & EMS (10.5%).
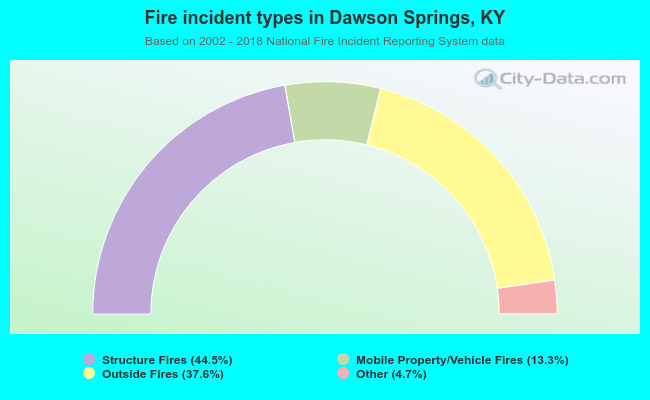 When looking into fire subcategories, the most incidents belonged to: Structure Fires (44.5%), and Outside Fires (37.6%).