| Fire incidents reported |
|---|
| Sreet name | Count |
|---|
| CONSTANT ST | 22 | | LEWIS ST | 12 | | NORTH FORK RD | 10 | | OAKCREST RD | 10 | | WEBSTER RD | 10 | | BELL FOUNTAIN RD | 8 | | CLEAR CREEK RD | 8 | | I-72 FWY | 8 | | JOHN WAYNE RD | 8 | | MCBURG RD | 8 | | STRAWBERRY LN | 8 | | TOWER RD | 8 | | DARNELL RD | 6 | | GARRETT | 6 | | GARRETT ST | 6 | | GREENRIDGE LN | 6 | | GRIFFITH CREEK RD | 6 | | HILLTOP | 6 | | LEDLIE ST. ST | 6 | | MAIN ST | 6 | | MECHANICSBURG RD | 6 | | OLD DECATUR RD. RD | 6 | | OLD U.S. 36 | 6 | | RT 36 | 6 | | SCULLY RD | 6 |
| | | Fire incidents reported |
|---|
| Sreet name | Count |
|---|
| US ROUTE 36 HWY | 6 | | WALNUT ST | 6 | | WALNUT ST. ST | 6 | | BELL FOUNTAIN | 4 | | BUFFALO HART RD | 4 | | BUFFALO HART RD. RD | 4 | | CLEAR CREEK RD | 4 | | CLEAR LAKE RD | 4 | | DAWSON LANE | 4 | | DESCH RD | 4 | | DESCH RD RD | 4 | | E WALNUT STREET ST | 4 | | ELM ST | 4 | | ELM ST. ST | 4 | | GARRET ST | 4 | | GARRETT ST | 4 | | JOHN WAYNE | 4 | | LOST SPRING RD | 4 | | NORTH FORK RD | 4 | | ROUTE 36 | 4 | | SCULLY RD. RD | 4 | | SHERMAN RD. RD | 4 | | SKULL RD | 4 | | U.S. ROUTE 36 HWY | 4 | | |
|
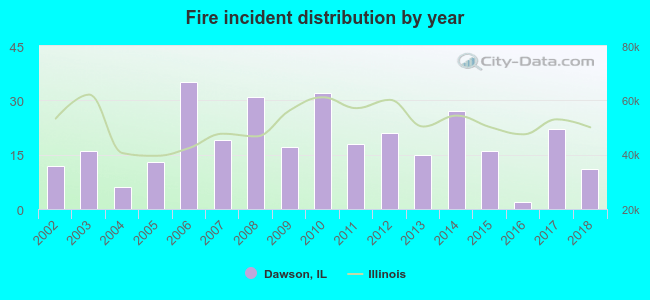 According to the data from the years 2002 - 2018 the average number of fire incidents per year is 18. The highest number of fires - 35 took place in 2006, and the least - 2 in 2016. The data has a dropping trend.
 21.4% incidents where reported in the morning and 78.6% in the evening. The most fires (16.6%) took place on Sunday, and the least (11.8%) on Tuesday.
 Based on the 313 fires from years 2002 - 2018 most fires (21.4%) took place during March, and the least (2.2%) in January.
 Out of all 996 cases reported during the years 2002 - 2018, the most belonged to the categories: Rescue & EMS (49.8%), Fire (31.4%), and Good Intent Call (6.2%).
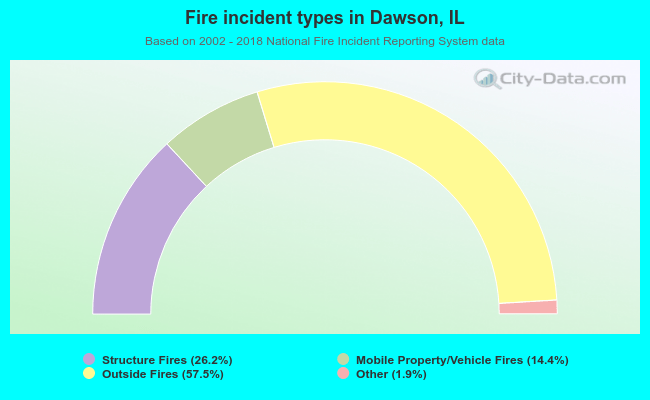 When looking into fire subcategories, the most incidents belonged to: Outside Fires (57.5%), and Structure Fires (26.2%).