Darrington: Fire Incidents, Washington (WA)
Where are fire incidents reported in Darrington, WA
Something went wrong! Please refresh the page.
|
| |||||||||||||||||||||||||||||||||||||||||||||||||||||||||||||||||||||||||||||||||||||||||||||||||||||||||||||
2002 - 2018 National Fire Incident Reporting System (NFIRS) incidents
- Incident types reported to NFIRS in Darrington, WA
- 1,52366.8%Rescue & EMS
- 29813.1%Fire
- 25411.1%Good Intent Call
- 934.1%Hazardous Condition
- 622.7%Service Call
- 341.5%False Alarm
- 120.5%Special Incident
- 30.1%Severe Weather
- Fire incident types reported to NFIRS in Darrington, WA
- 14047.0%Structure Fires
- 12441.6%Outside Fires
- 206.7%Mobile Property/Vehicle Fires
- 144.7%Other
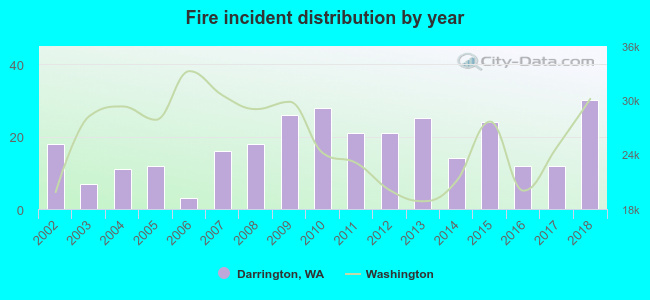 According to the data from the years 2002 - 2018 the average number of fires per year is 18. The highest number of reported fire incidents - 30 took place in 2018, and the least - 3 in 2006. The data has an increasing trend.
 26.2% incidents where reported in the morning and 73.8% in the evening. The most fires (17.4%) took place on Wednesday, and the least (11.7%) on Friday.
 According to the 298 fires from years 2002 - 2018 most fires (19.1%) took place during July, and the least (4.7%) in November.
 Out of all 2,279 cases reported during the years 2002 - 2018, the most belonged to the categories: Overpressure Rupture (66.8%), Fire (13.1%), and Service Call (11.1%).
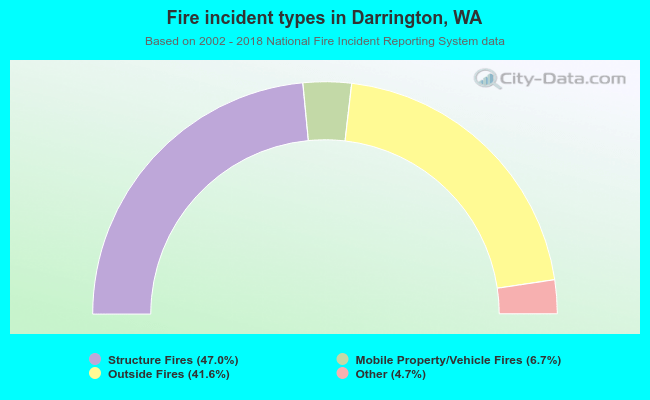 When looking into fire subcategories, the most incidents belonged to: Structure Fires (47.0%), and Outside Fires (41.6%).