Darlington: Fire Incidents, South Carolina (SC)
Where are fire incidents reported in Darlington, SC
Something went wrong! Please refresh the page.
|
| |||||||||||||||||||||||||||||||||||||||||||||||||||||||||||||||||||||||||||||||||||||||||||||||||||||||||||||
| Other | 257 | |||||||||||||||||||||||||||||||||||||||||||||||||||||||||||||||||||||||||||||||||||||||||||||||||||||||||||||
2004 - 2018 National Fire Incident Reporting System (NFIRS) incidents
- Incident types reported to NFIRS in Darlington, SC
- 1,83633.6%Rescue & EMS
- 1,22122.4%Fire
- 88416.2%Hazardous Condition
- 5189.5%Good Intent Call
- 5019.2%False Alarm
- 4718.6%Service Call
- 170.3%Severe Weather
- 80.1%Overpressure Rupture
- Fire incident types reported to NFIRS in Darlington, SC
- 49840.8%Structure Fires
- 47839.1%Outside Fires
- 22618.5%Mobile Property/Vehicle Fires
- 191.6%Other
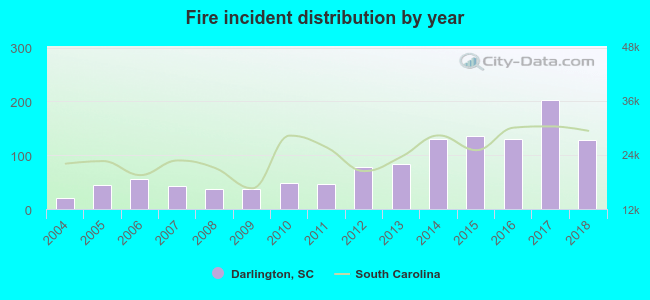 Based on the data from the years 2004 - 2018 the average number of fires per year is 81. The highest number of fire incidents - 202 took place in 2017, and the least - 20 in 2004. The data has a rising trend.
The average number of yearly fire incidents per 10k residents in Darlington, SC compared to nearest cities:
(Note: Based on data for the last 3 years, including only cities with population 5,000 and above)
| Darlington: | 247.1 |
| Florence: | 126.4 |
| Hartsville: | 310.7 |
| Bennettsville: | 181.1 |
| Cheraw: | 162.3 |
| Marion: | 88.9 |
| Dillon: | 6.5 |
| Lake City: | 190.6 |
| Hamer: | 11.2 |
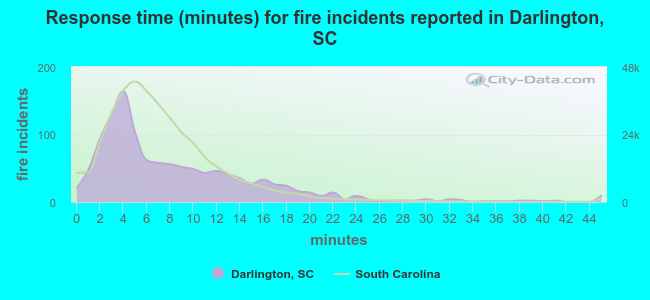 The median response time based on all reported fire incidents is 6 minutes. This is comparable to the state median value.
The median response time in Darlington, SC compared to nearest cities:
(Note: Based on data for all years, including only cities with at least 500 fire incidents)
| Darlington: | 6 minutes |
| Florence: | 6 minutes |
| Hartsville: | 6 minutes |
| Lynchburg: | 11 minutes |
| Bishopville: | 10 minutes |
| Bennettsville: | 5 minutes |
| Latta: | 8 minutes |
| Cheraw: | 6 minutes |
| Marion: | 6 minutes |
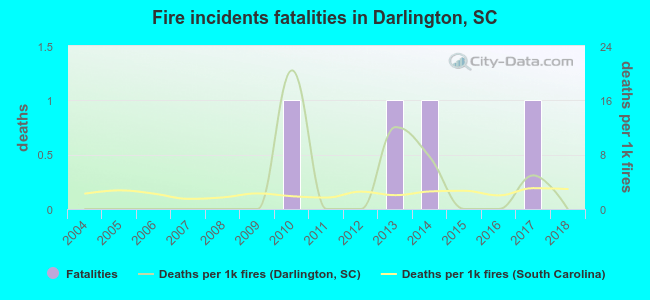 Based on the data from the years 2004 - 2018 the average number of fire-related fatalities per year is 0. The highest number of deaths - 1 took place in 2010, and the lowest - 0 in 2004. The data has a constant trend.
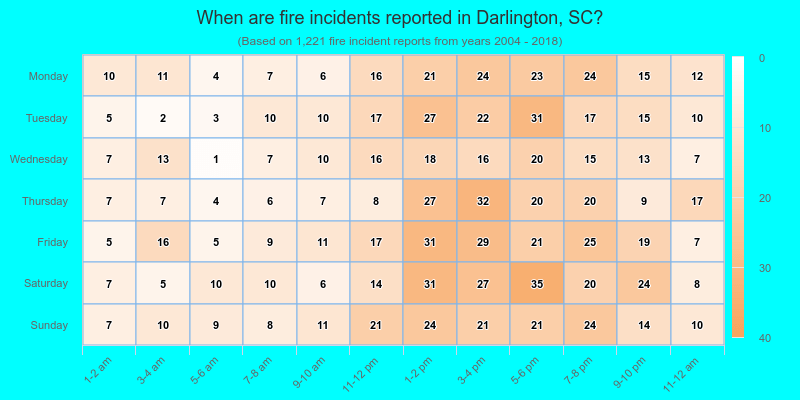
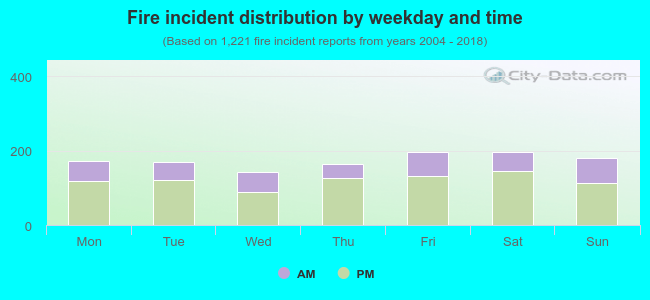 30.7% incidents where reported in the morning and 69.3% in the evening. The most fires (16.1%) took place on Saturday, and the least (11.7%) on Wednesday.
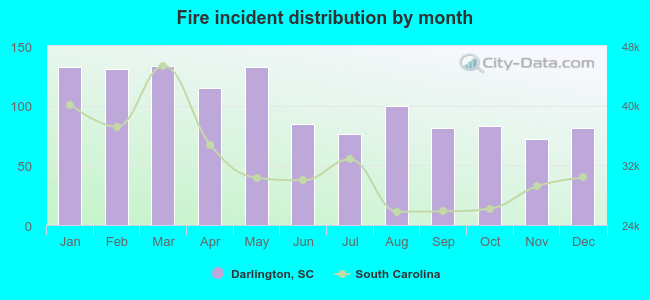 According to the 1,221 incident reports from years 2004 - 2018 most fires (10.9%) took place during March, and the least (5.9%) in November.
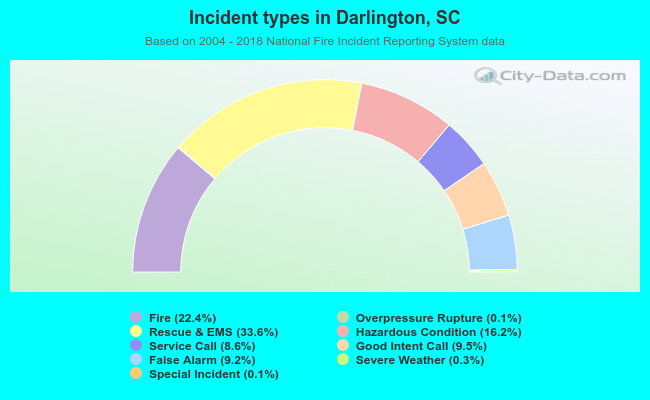 Out of all 5,459 cases reported during the years 2004 - 2018, the most belonged to the categories: Rescue & EMS (33.6%), Fire (22.4%), and Hazardous Condition (16.2%).
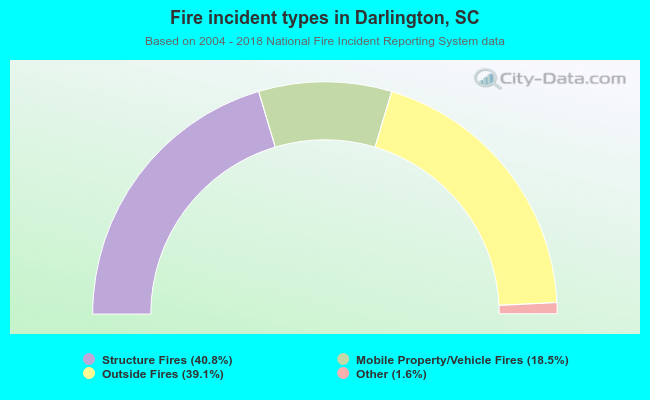 When looking into fire subcategories, the most reports belonged to: Structure Fires (40.8%), and Outside Fires (39.1%).