| Fire incidents reported |
|---|
| Sreet name | Count |
|---|
| MAIN STREET | 20 | | CHURCH STREET | 18 | | ST. WENDAL ROAD | 18 | | HIGHWAY 65 | 16 | | NORTH STREET | 12 | | EVANSVILLE STREET | 10 | | EMGE ROAD | 8 | | LANE ROAD | 8 | | MILL STREET | 8 | | CORBETT ROAD | 6 | | HIGHWAY 68 | 6 | | NORTH ST | 6 | | OWENSVILLE STREET | 6 | | WALNUT STREET | 6 | | WATER TANK ROAD | 6 | | 68 HWY | 4 | | CHURCH ST | 4 | | EVANSVILLE ??ST. ST | 4 | | MAIN ST | 4 | | MULKEY ROAD | 4 | | POPULAR STREET | 4 | | SHOWERS ROAD | 4 | | WATERTANK RD | 4 | | WHITING STREET | 4 | | 1000 GIBSON COUNTY ROAD | 2 |
| | | Fire incidents reported |
|---|
| Sreet name | Count |
|---|
| 10500 HILLVIEW EVANSVILLE | 2 | | BASELINE RD | 2 | | BASELINE RD | 2 | | BASELINE ROAD | 2 | | CHAD ROAD | 2 | | CHERRY ST. | 2 | | CLEVELAND RD | 2 | | CLEVELAND ROAD | 2 | | COUNTRY ??CROSS RD | 2 | | COUNTRY CROSS RD | 2 | | COUNTRY HOME CT | 2 | | COUNTY LINE ROAD | 2 | | EGME RD | 2 | | ELM ST | 2 | | EMGE RD | 2 | | EVANSVILLE ST | 2 | | GC | 2 | | GIBSON RD | 2 | | GIBSON ROAD | 2 | | GISH LANE | 2 | | GREELY STREET | 2 | | GRIES ROAD | 2 | | GUM STREET | 2 | | HARMONY WAY | 2 | | |
|
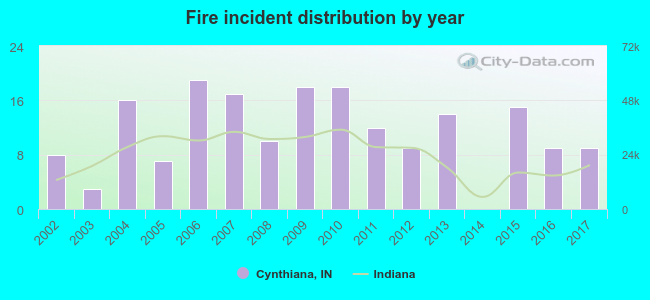 Based on the data from the years 2002 - 2017 the average number of fire incidents per year is 12. The highest number of reported fire incidents - 19 took place in 2006, and the least - 0 in 2014. The data has an increasing trend.
 29.3% incidents where reported in the morning and 70.7% in the evening. The most fires (17.4%) took place on Sunday, and the least (12.5%) on Monday.
 Based on the 184 fires from years 2002 - 2017 most fires (14.1%) took place during October, and the least (3.3%) in December.
 Out of all 408 cases reported during the years 2002 - 2017, the most belonged to the categories: Overpressure Rupture (45.8%), Fire (45.1%), and Rescue & EMS (5.4%).
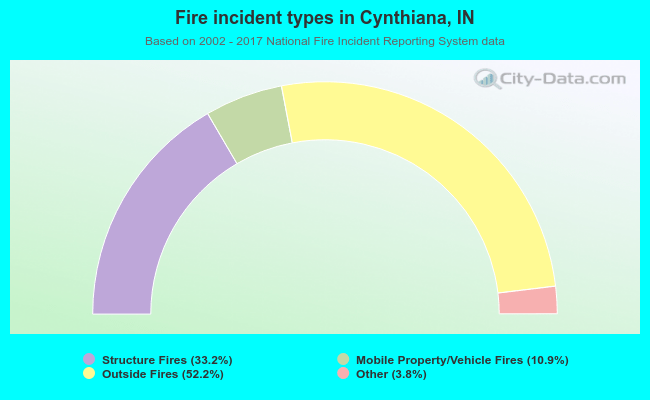 When looking into fire subcategories, the most incidents belonged to: Outside Fires (52.2%), and Structure Fires (33.2%).