| Fire incidents reported |
|---|
| Sreet name | Count |
|---|
| STATE ST | 16 | | WINDY HILL RD | 12 | | FILBERT ST | 8 | | PARK AVE | 8 | | SMITH ST | 8 | | WALNUT ST | 8 | | 4TH AVE | 6 | | GREENVILLE PIKE | 6 | | NAULTON RD | 6 | | PINE ST | 6 | | THOMPSON ST | 6 | | 1485 GREENVILLE PIKE | 4 | | ANDERSON ST | 4 | | BLOOMINGTON AVE | 4 | | KIRK ST | 4 | | MARRON RD | 4 | | MAXVILLE RD | 4 | | STATE STREET | 4 | | 10 4TH AVE | 2 | | 105 BRESSLER ROAD | 2 | | 1125 GREENWOOD RD | 2 | | 1573 GREENVILLE PIKE | 2 | | 160 BRESSLER RD | 2 | | 1ST ST | 2 | | 222 FILBER ST | 2 |
| | | Fire incidents reported |
|---|
| Sreet name | Count |
|---|
| 30 4TH AVE | 2 | | 430 CHESTNUT STREET | 2 | | 45 COOPER RD | 2 | | 618 MAXVILLE | 2 | | 659 NORRIS RD | 2 | | 709 ANN ST | 2 | | 949 SMAY RD | 2 | | BLOOMINGTON AVE EXT | 2 | | BRADLEY ST | 2 | | BRESSLER RD | 2 | | BRIDGEPORT RD | 2 | | BUCHANON ST | 2 | | CARBIDE RD | 2 | | CEMETERY RD | 2 | | FARM RD | 2 | | FREDRICKA AVE | 2 | | GREEN RD | 2 | | GREENVILLE PIKE | 2 | | GREENVILLE PIKE PIKE | 2 | | GREENWOOD RD | 2 | | GREENWOOD RD | 2 | | HEMLOCK HOLLOW RD RD | 2 | | HIGH ST | 2 | | J.O.C. LN | 2 | | |
|
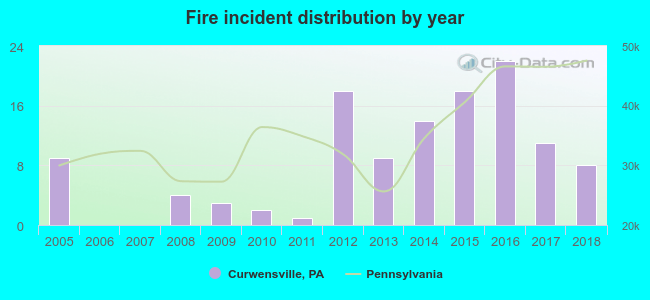 Based on the data from the years 2005 - 2018 the average number of fires per year is 9. The highest number of fire incidents - 22 took place in 2016, and the least - 0 in 2006. The data has a declining trend.
 42.0% incidents where reported in the morning and 58.0% in the evening. The most fires (19.3%) took place on Friday, and the least (10.1%) on Monday.
 According to the 119 fire incidents from years 2005 - 2018 most fires (24.4%) took place during January, and the least (1.7%) in October.
 Out of all 477 cases reported during the years 2005 - 2018, the most belonged to the categories: Fire (24.9%), Rescue & EMS (24.1%), and Hazardous Condition (18.2%).
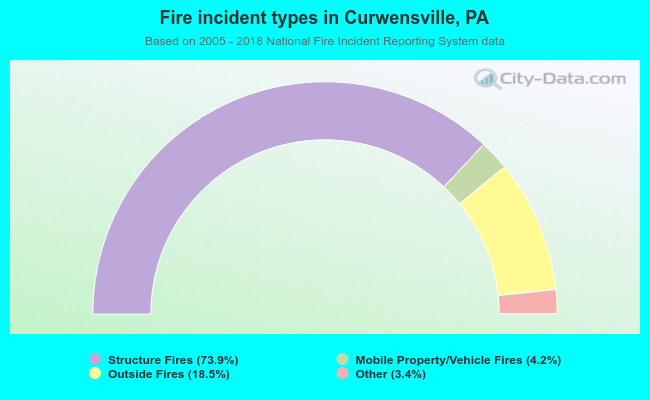 When looking into fire subcategories, the most reports belonged to: Structure Fires (73.9%), and Outside Fires (18.5%).