Cumming: Fire Incidents, Georgia (GA)
Where are fire incidents reported in Cumming, GA
Something went wrong! Please refresh the page.
| Fire incidents reported | |
|---|---|
| Sreet name | Count |
| NANCY LN | 294 |
| GEORGIA HIGHWAY 400 | 252 |
| ATLANTA HWY | 168 |
| CANTON HWY | 162 |
| BUFORD HWY | 142 |
| DAHLONEGA HWY | 116 |
| DR BRAMBLETT RD | 116 |
| KEITH BRIDGE RD | 116 |
| BROWNS BRIDGE RD | 104 |
| PEACHTREE PKY | 102 |
| MATT HWY | 94 |
| BETHELVIEW RD | 88 |
| ATLANTA RD | 76 |
| POST RD | 74 |
| SHILOH RD | 74 |
| BUFORD DAM RD | 66 |
| CASTLEBERRY RD | 62 |
| VETERANS MEMORIAL BLVD | 62 |
| SHADY GROVE RD | 56 |
| MARKET PLACE BLVD | 54 |
| PARKS RD | 54 |
| PILGRIM MILL RD | 54 |
| JOT EM DOWN RD | 50 |
| RONALD REAGAN BLVD | 50 |
| SETTINGDOWN RD | 50 |
| HOPEWELL RD | 48 |
| HURT BRIDGE RD | 48 |
| PEACHTREE | 46 |
| CORNERS PKY | 44 |
| HEARDSVILLE RD | 44 |
| Other | 2,630 |
2002 - 2018 National Fire Incident Reporting System (NFIRS) incidents
- Incident types reported to NFIRS in Cumming, GA
- 31,65650.4%Rescue & EMS
- 9,29514.8%Good Intent Call
- 7,90512.6%Service Call
- 5,3968.6%Fire
- 4,5537.3%Hazardous Condition
- 3,7986.0%False Alarm
- 1090.2%Severe Weather
- Fire incident types reported to NFIRS in Cumming, GA
- 2,69650.0%Outside Fires
- 1,83334.0%Structure Fires
- 84115.6%Mobile Property/Vehicle Fires
- 260.5%Other
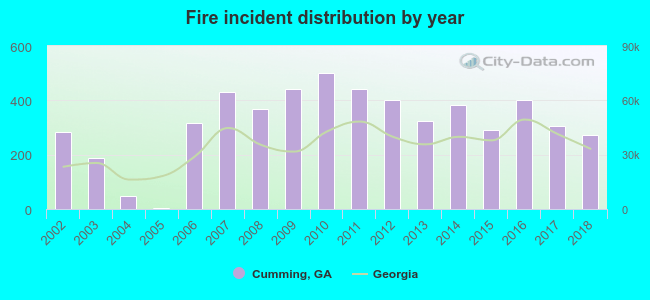 Based on the data from the years 2002 - 2018 the average number of fire incidents per year is 317. The highest number of fire incidents - 500 took place in 2010, and the least - 4 in 2005. The data has a decreasing trend.
The average number of yearly fire incidents per 10k residents in Cumming, GA compared to nearest cities:
(Note: Based on data for the last 3 years, including only cities with population 5,000 and above)
| Cumming: | 582.4 |
| Sugar Hill: | 0.5 |
| Buford: | 165.8 |
| Milton: | 24.2 |
| Suwanee: | 63.1 |
| Flowery Branch: | 122.7 |
| Alpharetta: | 29.3 |
| Johns Creek: | 8.3 |
| Duluth: | 65.1 |
 The median response time based on all reported fire incidents is 7 minutes. This is comparable to the state median value.
The median response time in Cumming, GA compared to nearest cities:
(Note: Based on data for all years, including only cities with at least 500 fire incidents)
| Cumming: | 7 minutes |
| Buford: | 8 minutes |
| Milton: | 6 minutes |
| Suwanee: | 8 minutes |
| Flowery Branch: | 7 minutes |
| Alpharetta: | 5 minutes |
| Johns Creek: | 6 minutes |
| Duluth: | 7 minutes |
| Dawsonville: | 8 minutes |
 Based on the data from the years 2002 - 2018 the average number of fire-related fatalities per year is 1. The highest number of reported deaths - 3 took place in 2010, and the lowest - 0 in 2003. The data has a decreasing trend.
The average number of deaths per 1,000 fires is 2. This indicator was the highest - 7 in 2015, and the lowest 0 in 2003. The trend for deaths per 1,000 fires is declining. Compared to the state value the number of deaths per 1,000 fire incidents is about the same.
Based on the data from the years 2002 - 2018 the average number of fire-related fatalities per year is 1. The highest number of reported deaths - 3 took place in 2010, and the lowest - 0 in 2003. The data has a decreasing trend.
The average number of deaths per 1,000 fires is 2. This indicator was the highest - 7 in 2015, and the lowest 0 in 2003. The trend for deaths per 1,000 fires is declining. Compared to the state value the number of deaths per 1,000 fire incidents is about the same.Deaths per 1,000 incidents in Cumming, GA compared to nearest cities:
(Note: Based on data for all years, including only cities with at least 2,500 fire incidents)
| Cumming: | 2.2 |
| Buford: | 2.2 |
| Alpharetta: | 0.7 |
| Roswell: | 1.2 |
| Gainesville: | 2.1 |
| Norcross: | 2.6 |
| Lawrenceville: | 2.5 |
| Canton: | 0.7 |
| Woodstock: | 1.8 |
 Based on the reports from the years 2002 - 2018 the average number of fire-related casualties per year is 2. The highest number of reported casualties - 5 took place in 2008, and the lowest - 0 in 2004. The data has a rising trend.
The average number of injuries per 1,000 fire incidents is 7. This indicator was the highest - 21 in 2003, and the lowest 0 in 2004. The trend for injuries per 1,000 fires is increasing. Compared to the Georgia value the number of injuries per 1,000 fires is about the same.
Based on the reports from the years 2002 - 2018 the average number of fire-related casualties per year is 2. The highest number of reported casualties - 5 took place in 2008, and the lowest - 0 in 2004. The data has a rising trend.
The average number of injuries per 1,000 fire incidents is 7. This indicator was the highest - 21 in 2003, and the lowest 0 in 2004. The trend for injuries per 1,000 fires is increasing. Compared to the Georgia value the number of injuries per 1,000 fires is about the same.Casualties per 1,000 incidents in Cumming, GA compared to nearest cities:
(Note: Based on data for all years, including only cities with at least 500 fire incidents)
| Cumming: | 7.6 |
| Buford: | 19.9 |
| Milton: | 11.8 |
| Suwanee: | 10.3 |
| Flowery Branch: | 11.2 |
| Alpharetta: | 10.5 |
| Johns Creek: | 16.1 |
| Duluth: | 15.3 |
| Dawsonville: | 5.2 |
 25.8% incidents where reported in the morning and 74.2% in the evening. The most fires (15.8%) took place on Saturday, and the least (12.5%) on Thursday.
 Based on the 5,396 fire incident reports from years 2002 - 2018 most fires (10.6%) took place during February, and the least (6.6%) in August.
 Out of all 62,796 cases reported during the years 2002 - 2018, the most belonged to the categories: Rescue & EMS (50.4%), Good Intent Call (14.8%), and Service Call (12.6%).
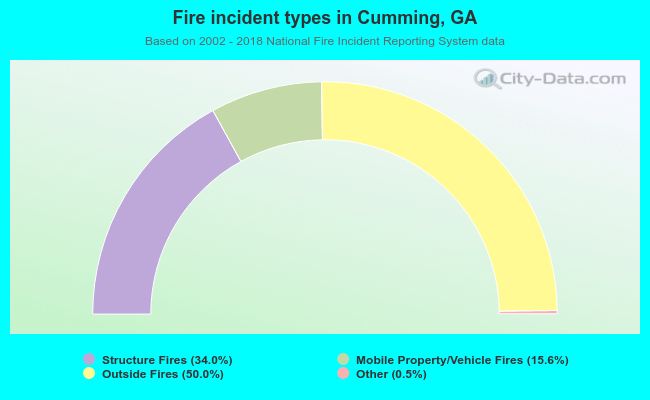 When looking into fire subcategories, the most reports belonged to: Outside Fires (50.0%), and Structure Fires (34.0%).