| Fire incidents reported |
|---|
| Sreet name | Count |
|---|
| MAIN ST | 12 | | CLOVERLICK RD | 10 | | U.S. 119 | 10 | | KY 522 HWY | 8 | | MASTIN DR | 8 | | 12255 HWY 522 | 6 | | HWY 522 | 6 | | OLD US HWY 119 BLAIR | 6 | | 12937 HWY 522 | 4 | | 17380 N HWY 119 | 4 | | BOGGS HOLLOW RD | 4 | | GILLEY HOLLOW RD | 4 | | HWY 119 | 4 | | KY 2006 HWY | 4 | | KY HWY 160 HWY | 4 | | KY522 HWY | 4 | | SAND HILL BOTTOM RD | 4 | | SLOPE HOLLOW | 4 | | SPENCER RD | 4 | | STACEY HILL | 4 | | STACY HL | 4 | | US 119 | 4 | | US HWY 119 HWY | 4 | | 17420 HWY 119 | 2 | | 024 SANDERS ST | 2 |
| | | Fire incidents reported |
|---|
| Sreet name | Count |
|---|
| 12005 HWY 522 | 2 | | 1314 EAST MAIN STREET | 2 | | 1318 SHEPHERD ST | 2 | | 15 MORRIS RD | 2 | | 1515 EAST MAIN ST | 2 | | 15165 HWY 522 | 2 | | 15165 HWY. 522 | 2 | | 15472 HWY 522 | 2 | | 15473 HWY 522 | 2 | | 158 GILLEY HOLLOW RD | 2 | | 1589 HWY 522 | 2 | | 16620 HWY 522 | 2 | | 17380 N HWY119 | 2 | | 18094 HWY 522 | 2 | | 203 STATE SQUARE | 2 | | 209 CENTRAL ST. | 2 | | 225 HOGG RD | 2 | | 23755 OLD HWY 119 | 2 | | 23755 OLD HWY119 | 2 | | 24614 N HWY 119 | 2 | | 298 RUSSELL DRIVE | 2 | | 304 RIVER RD. | 2 | | 35 MASTIN DRIVE | 2 | | 404 SCOTT COURT | 2 | | 408 MAIN STREET ST | 2 |
|
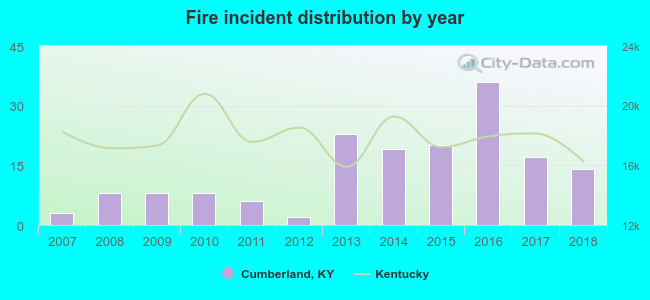 Based on the data from the years 2007 - 2018 the average number of fires per year is 14. The highest number of reported fires - 36 took place in 2016, and the least - 2 in 2012. The data has an increasing trend.
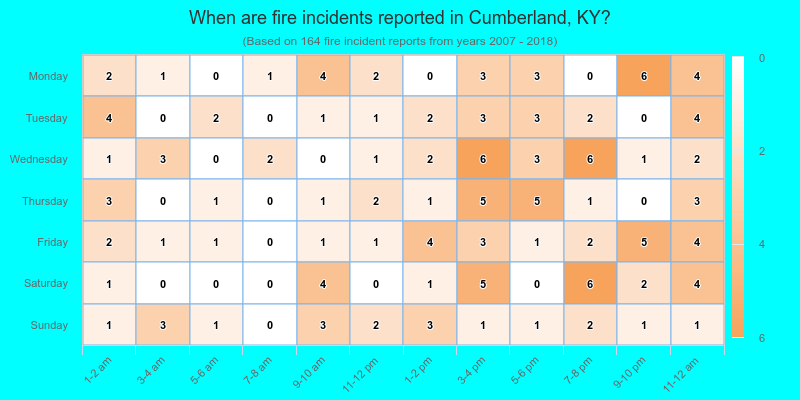
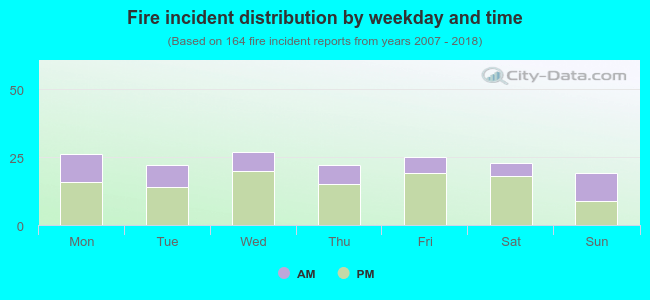 32.3% incidents where reported in the morning and 67.7% in the evening. The most fires (16.5%) took place on Wednesday, and the least (11.6%) on Sunday.
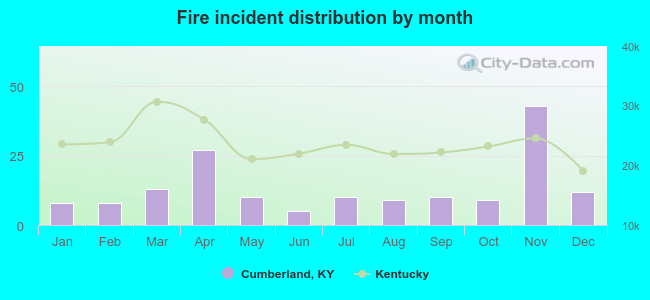 According to the 164 incident reports from years 2007 - 2018 most fires (26.2%) took place during November, and the least (3.0%) in June.
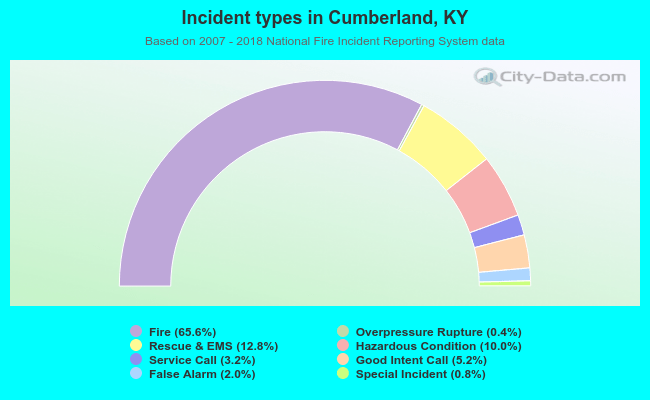 Out of all 250 cases reported during the years 2007 - 2018, the most belonged to the categories: Fire (65.6%), Rescue & EMS (12.8%), and Hazardous Condition (10.0%).
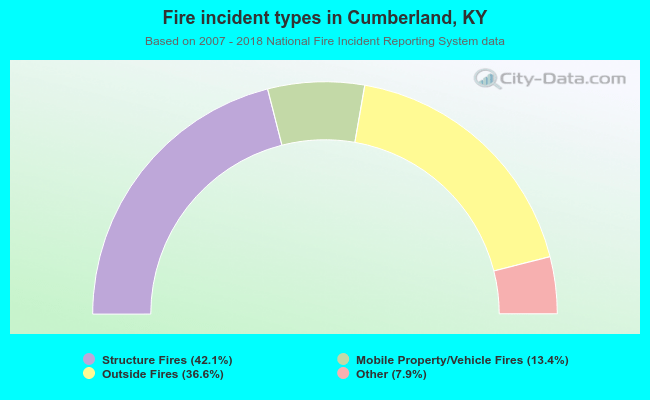 When looking into fire subcategories, the most incidents belonged to: Structure Fires (42.1%), and Outside Fires (36.6%).