| Fire incidents reported |
|---|
| Sreet name | Count |
|---|
| EAST RD | 12 | | EAST ROAD | 10 | | THOMAS ST. | 10 | | 2600 SOUTH ARKANSAS ST. | 6 | | EAST RD | 6 | | HWY 371 S. | 6 | | NICKERSON RD. | 6 | | SOUTH ARKANSAS | 6 | | 200 GEBSON ST | 4 | | 2800 S, ARK. ST | 4 | | CHAMBLISS RD | 4 | | COBB ST. | 4 | | COLLINS | 4 | | CULLEN SQUARE | 4 | | HENRIETTA WHITE | 4 | | KINGS CORNER RD | 4 | | KINGS ORCHARD RD | 4 | | NELSON ST. | 4 | | ORR ST. | 4 | | PAFFORD | 4 | | US 371 HWY | 4 | | WALNUT RD | 4 | | WALNUT RD. | 4 | | WILLIAMS | 4 | | 10 N COLLINS APT # 226 ST | 2 |
| | | Fire incidents reported |
|---|
| Sreet name | Count |
|---|
| 104 CARR ST | 2 | | 104 HOOD ST | 2 | | 105 S CURTIS ST | 2 | | 108 CARR ST | 2 | | 11 N COLLINS ST | 2 | | 110 S COLLINS ST | 2 | | 110 TAYLOR ST. | 2 | | 1102 HENRIETTA WHITE BLVD | 2 | | 1104 HARRINGTON DR | 2 | | 112 REVES ST | 2 | | 114 ORR ST | 2 | | 116 NEWSOME ST | 2 | | 117 COBB ST | 2 | | 12 N COLLINS | 2 | | 120 122 PAYNE ST | 2 | | 1207 7TH STREET SE ST | 2 | | 1210 HENRIETTA WHITE BLVD | 2 | | 1220 HENRITTA WHITE BLVD | 2 | | 127 ABBOTT CIR | 2 | | 1402 HENRIETTA WHITE BLVD | 2 | | 1501 WALNUT RD. | 2 | | 17 CAMELOT DR | 2 | | 17 CAMELOT DR DR | 2 | | 17 CAMELOT DR. | 2 | | |
|
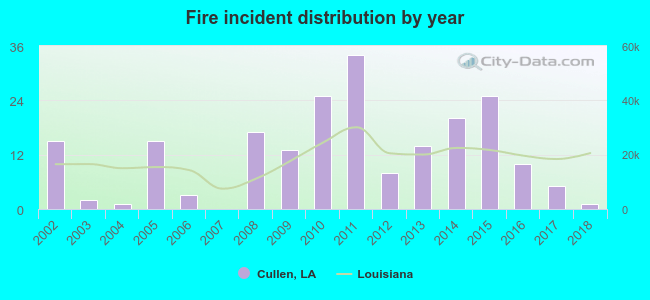 Based on the data from the years 2002 - 2018 the average number of fires per year is 12. The highest number of reported fire incidents - 34 took place in 2011, and the least - 0 in 2007. The data has a dropping trend.
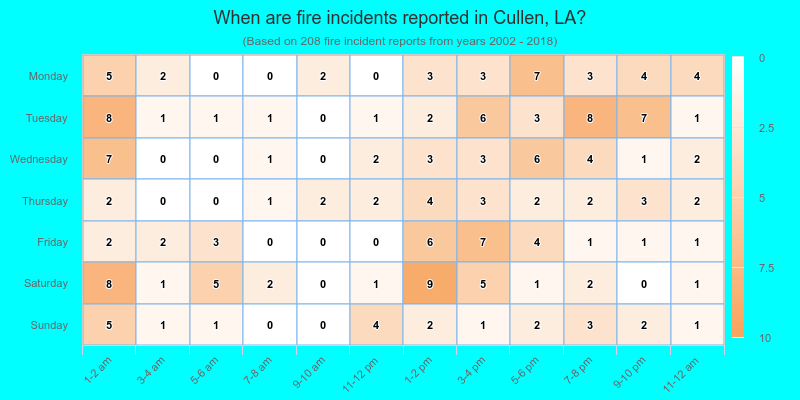
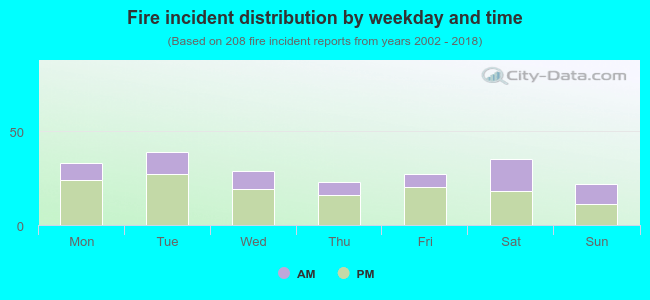 35.1% incidents where reported in the morning and 64.9% in the evening. The most fires (18.8%) took place on Tuesday, and the least (10.6%) on Sunday.
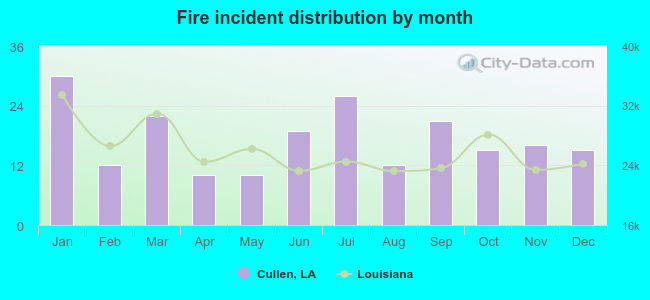 Based on the 208 incident reports from years 2002 - 2018 most fires (14.4%) took place during January, and the least (4.8%) in April.
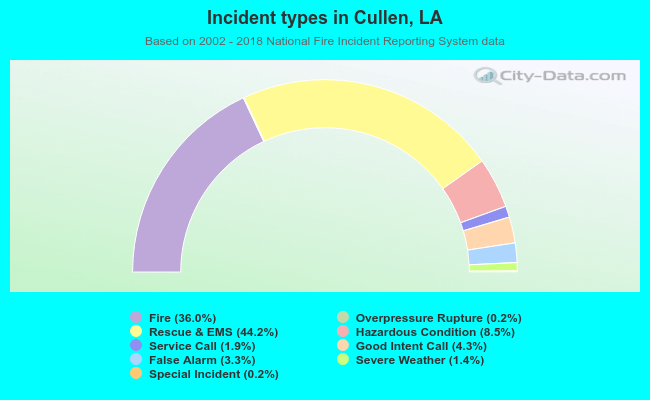 Out of all 577 cases reported during the years 2002 - 2018, the most belonged to the categories: Rescue & EMS (44.2%), Fire (36.0%), and Hazardous Condition (8.5%).
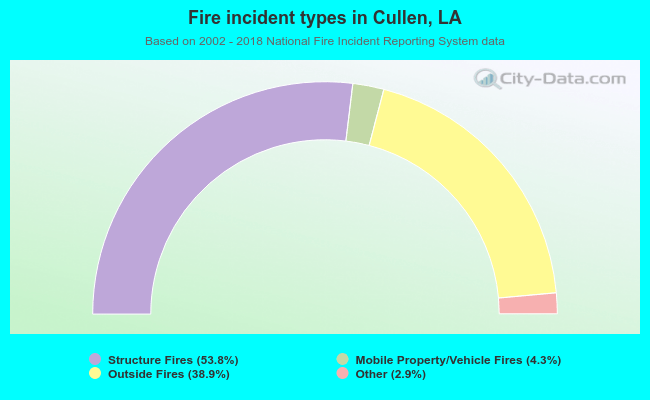 When looking into fire subcategories, the most reports belonged to: Structure Fires (53.8%), and Outside Fires (38.9%).