| Fire incidents reported |
|---|
| Sreet name | Count |
|---|
| MODEL ROAD | 10 | | QUARRY RD | 10 | | SAINT ROSE RD | 10 | | HILL RD | 8 | | MODEL RD | 8 | | 30352 CTY HWY H | 6 | | 4791 WEST LANE | 6 | | CHURCH RD | 6 | | COUNTY H | 6 | | MAIN ST | 6 | | ST ROSE RD | 6 | | 10624 SOUTH GALENA ROAD | 4 | | 1995 MODEL RD | 4 | | 2149 LOUISBURG RD. | 4 | | 725 NORTH JACKSON | 4 | | CENTER RD | 4 | | CHURCH RD | 4 | | CLAY ST | 4 | | COUNTY H HWY | 4 | | COUNTY H RD | 4 | | COUNTY HIGHWAY H | 4 | | HWY 80 | 4 | | HWY 80 SOUTH | 4 | | JACKSON ST | 4 | | KENNEDY STREET | 4 |
| | | Fire incidents reported |
|---|
| Sreet name | Count |
|---|
| KIRKWOOD RD. | 4 | | LINCOLN ST | 4 | | LOUISBURG ROAD | 4 | | MODEL RD | 4 | | RANDOLPH ST | 4 | | WASHINGTON ST | 4 | | 1008 CTY H | 2 | | 1008 CTY H WEST HWY | 2 | | 10487 COUNTY HIGHWAY H | 2 | | 10487 CTY H | 2 | | 1058 ST ROSE STREET | 2 | | 10700 S. GALENA RD. | 2 | | 10700 SOUTH GALENA ROAD | 2 | | 10742 COUTHARD LANE | 2 | | 1094 CTY H | 2 | | 1111 LOUISBURG RD. | 2 | | 116 WEST BRYAN STREET | 2 | | 1184 HEIL ROAD | 2 | | 119 NORTH MAIN | 2 | | 120 EAST YUBA | 2 | | 1350 CHURCH RD | 2 | | 1506 WIEGMAN LN | 2 | | 1676 CO. RD H | 2 | | 203 SOUTH MAIN | 2 | | |
|
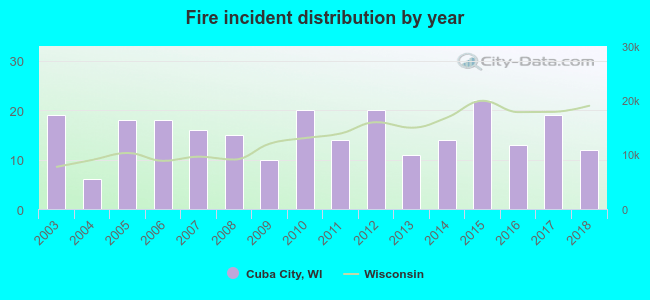 Based on the data from the years 2003 - 2018 the average number of fire incidents per year is 15. The highest number of fire incidents - 22 took place in 2015, and the least - 6 in 2004. The data has a dropping trend.
 40.5% incidents where reported in the morning and 59.5% in the evening. The most fires (17.4%) took place on Sunday, and the least (11.7%) on Tuesday.
 According to the 247 incident reports from years 2003 - 2018 most fires (15.4%) took place during April, and the least (4.5%) in December.
 Out of all 460 cases reported during the years 2003 - 2018, the most belonged to the categories: Fire (53.7%), Rescue & EMS (16.7%), and Overpressure Rupture (15.9%).
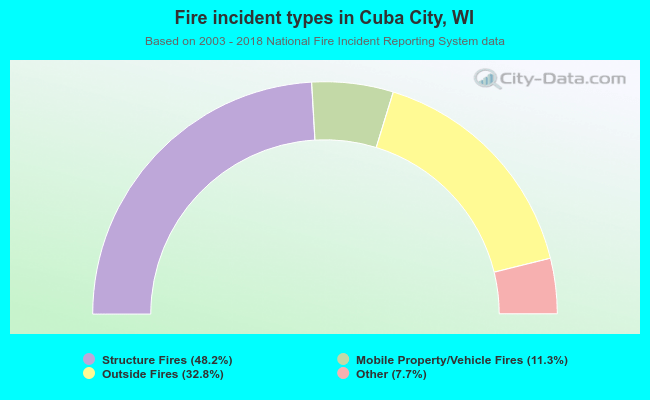 When looking into fire subcategories, the most incidents belonged to: Structure Fires (48.2%), and Outside Fires (32.8%).