| Fire incidents reported |
|---|
| Sreet name | Count |
|---|
| STATE RT 218 | 18 | | HANNAN TRACE RD | 16 | | ELLIOT RD | 14 | | HANNAN TRACE RD. RD | 14 | | STATE ROUTE 7 | 14 | | STATE ROUTE 7 SOUTH | 12 | | CR-73 | 10 | | STATE ROUTE 218 HWY | 10 | | STATE ROUTE 7 HWY | 10 | | COX RD. RD | 8 | | CR-72 | 8 | | PETERS BRANCH RD | 8 | | ROCKY FORK RD | 8 | | ST RT 218 | 8 | | STATE ROUTE 218 | 8 | | BLADEN RD | 6 | | BLADEN RD RD | 6 | | BOGGS RD | 6 | | CARGO RD. RD | 6 | | CO RD 9 | 6 | | HANNAN TRACE | 6 | | HANNAN TRACE RD | 6 | | LINCOLN PIKE | 6 | | MUD SOC RD | 6 | | ST RT 218 RT | 6 |
| | | Fire incidents reported |
|---|
| Sreet name | Count |
|---|
| ST RT 7 | 6 | | STATE ROUTE 790 HWY | 6 | | STATE RT 790 | 6 | | VINE ST | 6 | | 15747 ST RT 7 | 4 | | ATHA ROAD | 4 | | BLADEN RD | 4 | | BLADEN ROAD | 4 | | CALL RD RD | 4 | | CLAY LICK ROAD | 4 | | CLAY LICK RD | 4 | | COUNTY ROAD 195 | 4 | | COX RD | 4 | | ELLIOTT RD RD | 4 | | GARLAND CREEK RD | 4 | | GOOD HOPE RD | 4 | | HAMILTON RD | 4 | | KING RD. RD | 4 | | LITTLE BULLSKIN RD | 4 | | PARSONS RD. RD | 4 | | PERKINS RD | 4 | | S R 553 | 4 | | SILOAM RD | 4 | | SMOKIE ROW ROAD | 4 | | |
|
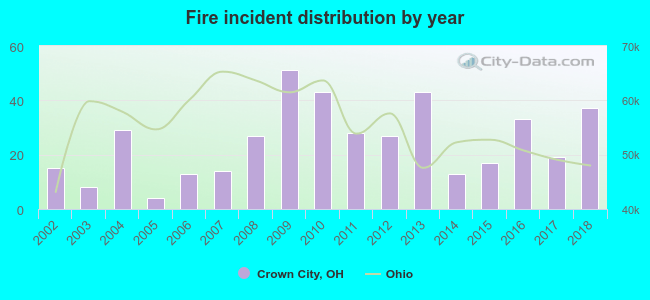 According to the data from the years 2002 - 2018 the average number of fires per year is 25. The highest number of reported fire incidents - 51 took place in 2009, and the least - 4 in 2005. The data has a growing trend.
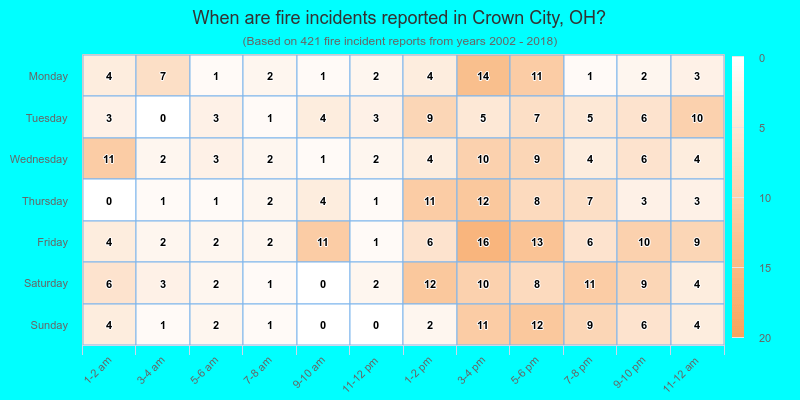
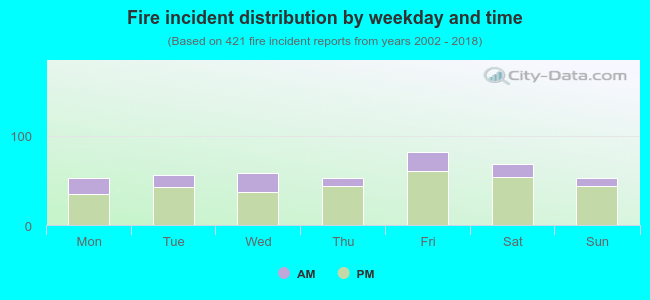 24.9% incidents where reported in the morning and 75.1% in the evening. The most fires (19.5%) took place on Friday, and the least (12.4%) on Monday.
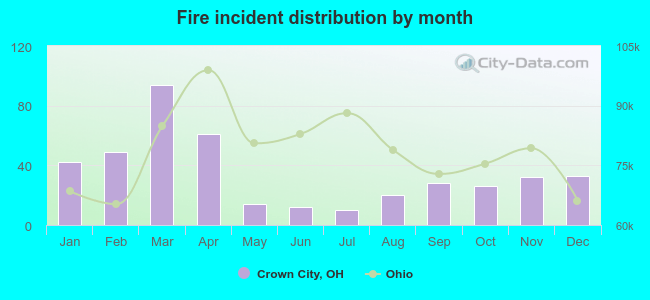 Based on the 421 fire incident reports from years 2002 - 2018 most fires (22.3%) took place during March, and the least (2.4%) in July.
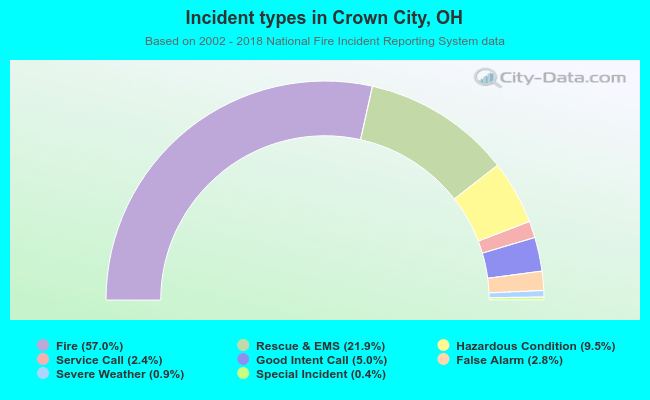 Out of all 739 cases reported during the years 2002 - 2018, the most belonged to the categories: Fire (57.0%), Overpressure Rupture (21.9%), and Rescue & EMS (9.5%).
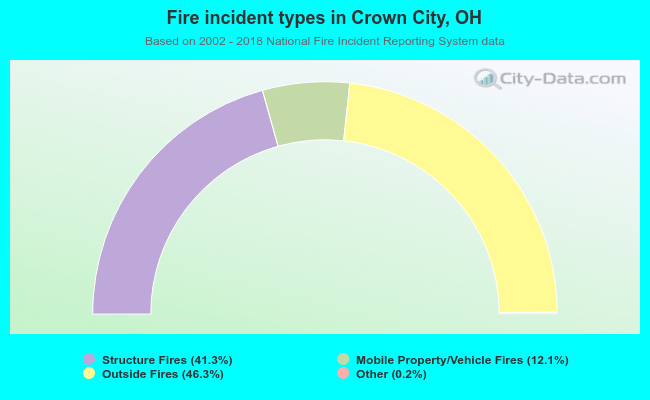 When looking into fire subcategories, the most reports belonged to: Outside Fires (46.3%), and Structure Fires (41.3%).