| Fire incidents reported |
|---|
| Sreet name | Count |
|---|
| MAIN ST | 20 | | POTTER ST | 14 | | CROSS ST | 12 | | RUDOLPH ST | 12 | | SECOND ST | 8 | | WINKLER ST | 8 | | COUNTY ROAD 1830 N | 6 | | FOURTH ST | 6 | | IL HWY 14 | 6 | | MORRILL ST | 6 | | 105 POTTER ST | 4 | | COUNTY ROAD 1375 E | 4 | | COUNTY ROAD 1450 E | 4 | | COUNTY ROAD 1500 E | 4 | | COUNTY ROAD 1600 E | 4 | | COUNTY ROAD 1800 N | 4 | | COUNTY ROAD 1950 N | 4 | | MORELL ST | 4 | | RAWLINSON ST | 4 | | 1450E | 2 | | 2104 CO. RD. 1725 E. | 2 | | 500 W MAIN STREET | 2 | | 500 WEST SPRING STREET | 2 | | 503 WEST MAIN STREET | 2 | | 507 NORTH CROSS | 2 |
| | | Fire incidents reported |
|---|
| Sreet name | Count |
|---|
| 600 EAST MAIN STREET | 2 | | CO RD 1500E | 2 | | CO RD 1600E | 2 | | CO RD 1950 N 1450 E RD | 2 | | COUNTY ROAD 1225 E | 2 | | COUNTY ROAD 1225E | 2 | | COUNTY ROAD 1400E | 2 | | COUNTY ROAD 1525E | 2 | | COUNTY ROAD 1600 N | 2 | | COUNTY ROAD 1625 E | 2 | | COUNTY ROAD 1625N | 2 | | COUNTY ROAD 1650 E | 2 | | COUNTY ROAD 1650 N | 2 | | COUNTY ROAD 1675 N | 2 | | COUNTY ROAD 1725 E | 2 | | COUNTY ROAD 1790 E | 2 | | COUNTY ROAD 1800E | 2 | | COUNTY ROAD 1800N | 2 | | COUNTY ROAD 1900 N | 2 | | COUNTY ROAD 1975 E | 2 | | COUNTY ROAD 1975 EAST | 2 | | COUNTY ROAD 2075 N | 2 | | COUNTY ROAD 2200 N | 2 | | COUNTY ROAD 2200N | 2 | | COUNTY ROAD 2300 E | 2 |
|
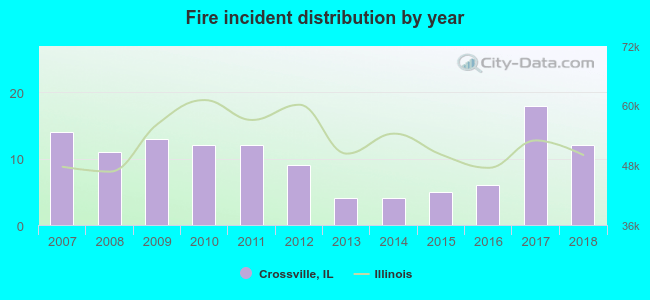 According to the data from the years 2007 - 2018 the average number of fire incidents per year is 10. The highest number of reported fires - 18 took place in 2017, and the least - 4 in 2013. The data has a decreasing trend.
 43.3% incidents where reported in the morning and 56.7% in the evening. The most fires (18.3%) took place on Monday, and the least (8.3%) on Sunday.
 Based on the 120 fire incidents from years 2007 - 2018 most fires (16.7%) took place during December, and the least (2.5%) in January.
 Out of all 154 cases reported during the years 2007 - 2018, the most belonged to the categories: Fire (77.9%), Rescue & EMS (7.1%), and False Alarm (4.5%).
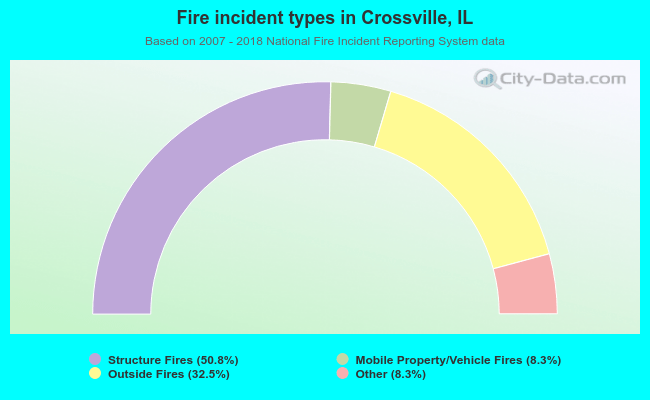 When looking into fire subcategories, the most incidents belonged to: Structure Fires (50.8%), and Outside Fires (32.5%).