| Fire incidents reported |
|---|
| Sreet name | Count |
|---|
| CARQUINEZ SCENIC DR | 20 | | CUMMINGS SKWY | 18 | | CUMMINGS SKWY | 14 | | I-80 | 14 | | SAN PABLO AVE | 14 | | CUMMINGS SKYWAY | 10 | | WINSLOW ST | 8 | | I 80 | 6 | | POMONA AVE | 6 | | 0 | 4 | | CANYON LAKE DR | 4 | | CROCKETT BLVD | 4 | | LORING AVE | 4 | | MCEWEN RD | 4 | | NANTUCKET | 4 | | TOST CT | 4 | | UP TRACKS | 4 | | 8098 CUMMINGS SKWY | 2 | | 0 I 80 EAST AT CUMMINGS | 2 | | 1206 WANDA ST | 2 | | 2ND | 2 | | A ST | 2 | | BAY ST | 2 | | CARQ SCENIC DR | 2 | | CARQUINEZ SCENIC DR | 2 |
| | | Fire incidents reported |
|---|
| Sreet name | Count |
|---|
| COMMINGS SKY WAY | 2 | | CUMMINGS SKYWAY TO | 2 | | CUMMINGS SKYWAY TO I 80 | 2 | | CUMMINGS SKYWAYI 80 | 2 | | DEL MAR CIR | 2 | | DEPERU DR | 2 | | DUPERU | 2 | | E/B 80 AT CUMMINGS OFF | 2 | | EB 80 AT CROCKETT EX | 2 | | EB 80 PRIOR TO CUMMI | 2 | | FRANKLIN CANYON RD | 2 | | I-80 X HWY 9 | 2 | | I80 FWY | 2 | | INTERSTATE 80 | 2 | | LORING | 2 | | OLD COUNTY RD | 2 | | POMONA ST | 2 | | PORT COSTA | 2 | | PORT ST | 2 | | ROLPH PARK | 2 | | ROSE ST | 2 | | RXR TRACKS | 2 | | SAN PABLO AVE | 2 | | SAN PABLO BLVD | 2 | | |
|
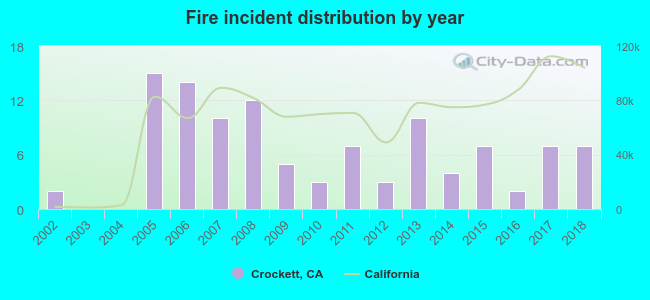 Based on the data from the years 2002 - 2018 the average number of fires per year is 6. The highest number of reported fire incidents - 15 took place in 2005, and the least - 0 in 2003. The data has a rising trend.
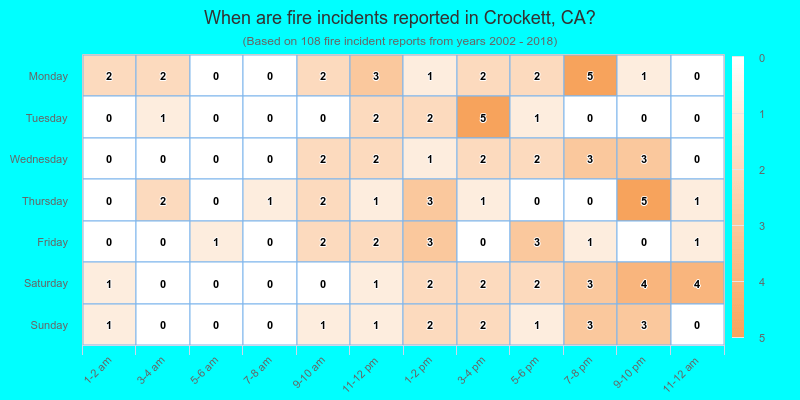
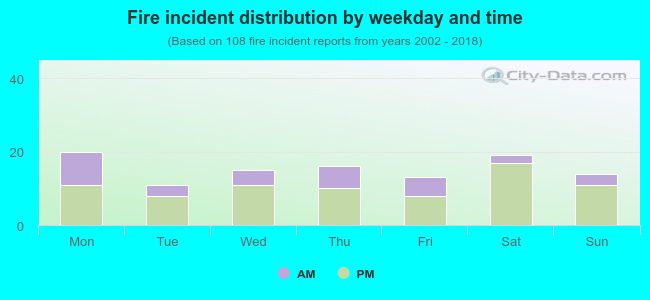 29.6% incidents where reported in the morning and 70.4% in the evening. The most fires (18.5%) took place on Monday, and the least (10.2%) on Tuesday.
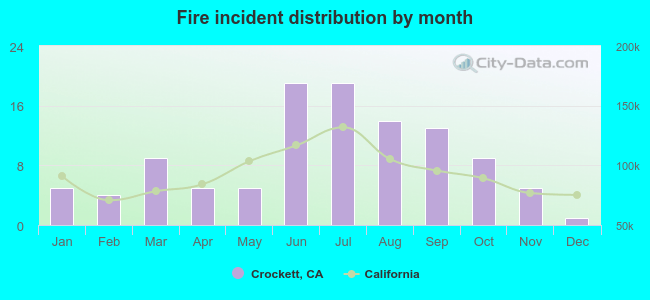 According to the 108 fire incident reports from years 2002 - 2018 most fires (17.6%) took place during June, and the least (0.9%) in December.
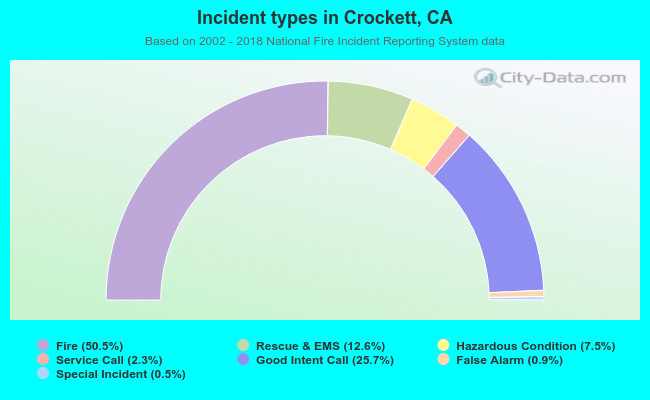 Out of all 214 cases reported during the years 2002 - 2018, the most belonged to the categories: Fire (50.5%), Service Call (25.7%), and Overpressure Rupture (12.6%).
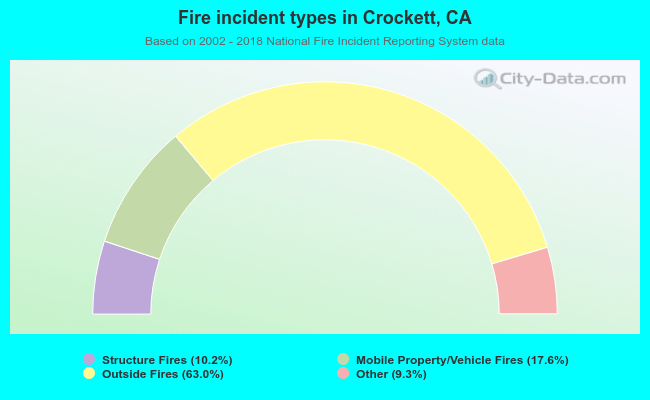 When looking into fire subcategories, the most reports belonged to: Outside Fires (63.0%), and Mobile Property/Vehicle Fires (17.6%).