Crescent City: Fire Incidents, California (CA)
Where are fire incidents reported in Crescent City, CA
Something went wrong! Please refresh the page.
|
| |||||||||||||||||||||||||||||||||||||||||||||||||||||||||||||||||||||||||||||||||||||||||||||||||||||||||||||
| Other | 198 | |||||||||||||||||||||||||||||||||||||||||||||||||||||||||||||||||||||||||||||||||||||||||||||||||||||||||||||
2005 - 2018 National Fire Incident Reporting System (NFIRS) incidents
- Incident types reported to NFIRS in Crescent City, CA
- 2,44657.1%Rescue & EMS
- 90821.2%Fire
- 3157.4%Service Call
- 2836.6%Hazardous Condition
- 1704.0%Good Intent Call
- 1623.8%False Alarm
- Fire incident types reported to NFIRS in Crescent City, CA
- 60266.3%Outside Fires
- 19821.8%Structure Fires
- 9410.4%Mobile Property/Vehicle Fires
- 141.5%Other
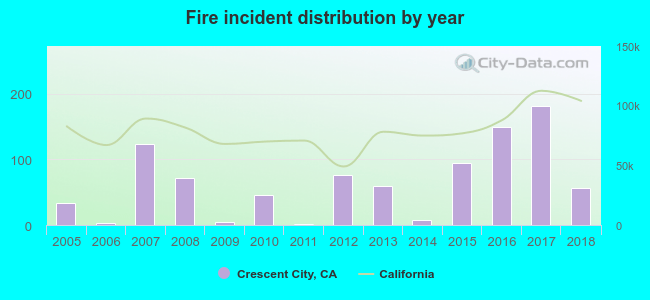 According to the data from the years 2005 - 2018 the average number of fires per year is 65. The highest number of fires - 182 took place in 2017, and the least - 1 in 2011. The data has an increasing trend.
The average number of yearly fire incidents per 10k residents in Crescent City, CA compared to nearest cities:
(Note: Based on data for the last 3 years, including only cities with population 5,000 and above)
| Crescent City: | 190.6 |
| McKinleyville: | 36.0 |
| Arcata: | 51.3 |
| Eureka: | 2.5 |
| Yreka: | 28.6 |
| Fortuna: | 1.7 |
 The median response time based on all reported fire incidents is 5 minutes. This is lower compared to the state median value.
The median response time in Crescent City, CA compared to nearest cities:
(Note: Based on data for all years, including only cities with at least 500 fire incidents)
| Crescent City: | 5 minutes |
| McKinleyville: | 6 minutes |
| Arcata: | 6 minutes |
| Eureka: | 6 minutes |
 36.0% incidents where reported in the morning and 64.0% in the evening. The most fires (16.2%) took place on Sunday, and the least (11.3%) on Thursday.
 Based on the 908 incident reports from years 2005 - 2018 most fires (15.5%) took place during July, and the least (3.6%) in December.
 Out of all 4,284 cases reported during the years 2005 - 2018, the most belonged to the categories: Overpressure Rupture (57.1%), Fire (21.2%), and Hazardous Condition (7.4%).
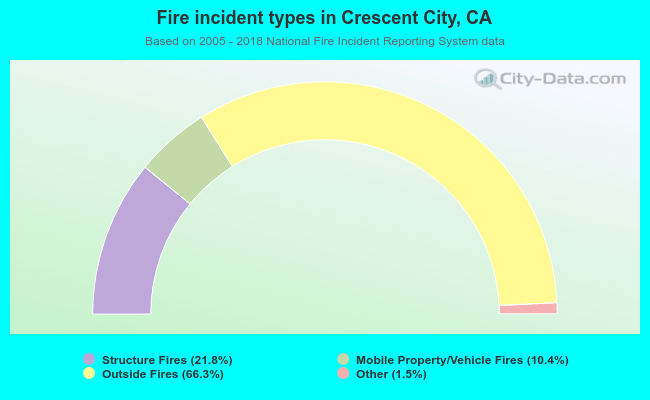 When looking into fire subcategories, the most reports belonged to: Outside Fires (66.3%), and Structure Fires (21.8%).