| Fire incidents reported |
|---|
| Sreet name | Count |
|---|
| RT 13 | 8 | | ST RT 153 | 6 | | 2600 STATE RT 153 N | 4 | | 4TH ST | 4 | | 544 HOLLYHOCK RD | 4 | | FLEURDELIS RD | 4 | | GOLDENROD RD | 4 | | HOLLY HOCK RD | 4 | | LARKSPUR RD | 4 | | PONEY RD | 4 | | POPLAR ST | 4 | | RT. 13 | 4 | | SARAH RD | 4 | | THIRD | 4 | | WINKLE RD | 4 | | 100 HOLLYHOCK RD | 2 | | 100 RAILROAD ST. | 2 | | 100RAILROAD ST. | 2 | | 1011 S 5TH ST | 2 | | 1011S.FIFTH | 2 | | 1013 VIOLET RD | 2 | | 104 RANDOLPH ST | 2 | | 104 S 5TH ST | 2 | | 105 GRANT | 2 | | 105 KING ST | 2 |
| | | Fire incidents reported |
|---|
| Sreet name | Count |
|---|
| 105 S GRANT ST | 2 | | 107 EAST ELM ST | 2 | | 107 N 4TH | 2 | | 10882 PREST RD | 2 | | 10920 POPLAR | 2 | | 11061 POPLAR ST | 2 | | 11085 POPLAR ST | 2 | | 1109 ST RT 13 | 2 | | 111 E GRANT | 2 | | 11161 WASHINGTON RD | 2 | | 11185 S MAIN ST | 2 | | 112 W KING ST | 2 | | 1138 ST RT 13 | 2 | | 1176 CO.HWY.12 | 2 | | 12329 ST RT13 | 2 | | 1275 RANDOLPH ST | 2 | | 12768 SARAH RD | 2 | | 12768 SARAH RD. | 2 | | 12807 STATE RT13WEST | 2 | | 12851 REID LN. | 2 | | 130781 CITY LAKE RD | 2 | | 13101 TALBERT LANE | 2 | | 13138 ST RT 13 | 2 | | 13288 TALBERT LN | 2 | | |
|
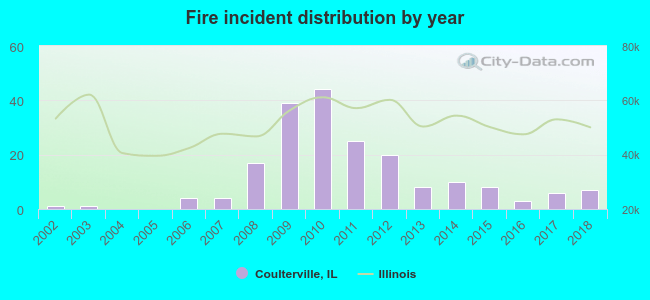 Based on the data from the years 2002 - 2018 the average number of fires per year is 12. The highest number of fire incidents - 44 took place in 2010, and the least - 0 in 2004. The data has a growing trend.
 34.5% incidents where reported in the morning and 65.5% in the evening. The most fires (17.8%) took place on Tuesday, and the least (11.2%) on Friday.
 According to the 197 fires from years 2002 - 2018 most fires (11.2%) took place during August, and the least (4.6%) in December.
 Out of all 612 cases reported during the years 2002 - 2018, the most belonged to the categories: Rescue & EMS (55.2%), Fire (32.2%), and Hazardous Condition (10.0%).
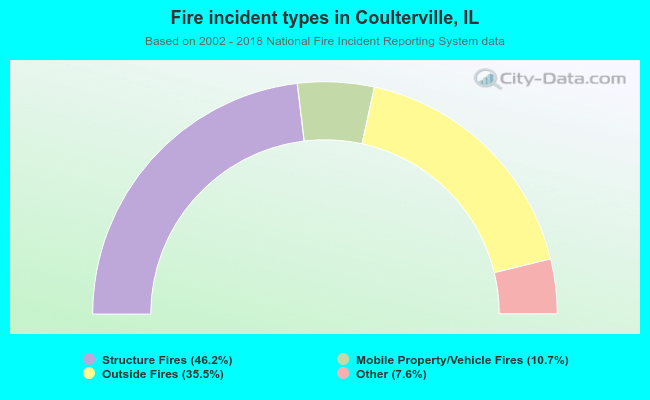 When looking into fire subcategories, the most incidents belonged to: Structure Fires (46.2%), and Outside Fires (35.5%).