Corvallis: Fire Incidents, Oregon (OR)
Where are fire incidents reported in Corvallis, OR
Something went wrong! Please refresh the page.
| Fire incidents reported | |
|---|---|
| Sreet name | Count |
| 9TH ST | 162 |
| 3RD ST | 132 |
| CIRCLE BLVD | 108 |
| UNREPORTED ST | 74 |
| 2ND ST | 72 |
| KINGS BLVD | 64 |
| MONROE AVE | 62 |
| 4TH ST | 52 |
| CONIFER BLVD | 52 |
| WESTERN BLVD | 52 |
| 26TH ST | 50 |
| UNREPORTED AVE | 50 |
| HARRISON BLVD | 48 |
| 15TH ST | 44 |
| 5TH ST | 44 |
| 23RD ST | 42 |
| 6TH ST | 42 |
| 53RD ST | 40 |
| 10TH ST | 38 |
| 13TH ST | 38 |
| WALNUT BLVD | 38 |
| PHILOMATH BLVD | 36 |
| UNREPORTED | 34 |
| 11TH ST | 32 |
| 27TH ST | 30 |
| 29TH ST | 28 |
| B AVE | 26 |
| ELLIOTT CIR | 26 |
| UNREPORTED BLVD | 26 |
| WITHAM HILL DR | 26 |
| Other | 294 |
2002 - 2018 National Fire Incident Reporting System (NFIRS) incidents
- Incident types reported to NFIRS in Corvallis, OR
- 8,04655.7%Rescue & EMS
- 1,86212.9%Fire
- 1,64711.4%Service Call
- 1,2168.4%Good Intent Call
- 9706.7%Hazardous Condition
- 6894.8%False Alarm
- Fire incident types reported to NFIRS in Corvallis, OR
- 93450.2%Outside Fires
- 60532.5%Structure Fires
- 20811.2%Mobile Property/Vehicle Fires
- 1156.2%Other
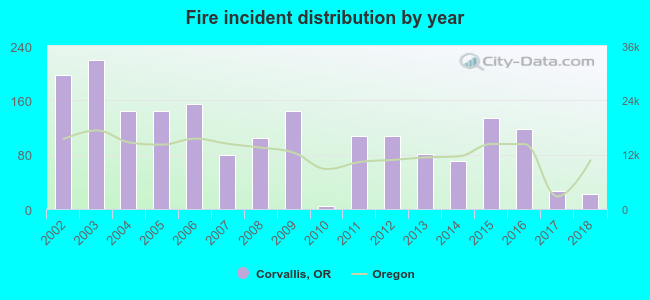 According to the data from the years 2002 - 2018 the average number of fires per year is 110. The highest number of reported fire incidents - 220 took place in 2003, and the least - 5 in 2010. The data has a dropping trend.
The average number of yearly fire incidents per 10k residents in Corvallis, OR compared to nearest cities:
(Note: Based on data for the last 3 years, including only cities with population 5,000 and above)
| Corvallis: | 10.1 |
| Albany: | 12.8 |
| Lebanon: | 31.7 |
| Monmouth: | 14.7 |
| Independence: | 14.4 |
| Dallas: | 26.9 |
| Junction City: | 44.4 |
| Salem: | 25.0 |
| Stayton: | 34.4 |
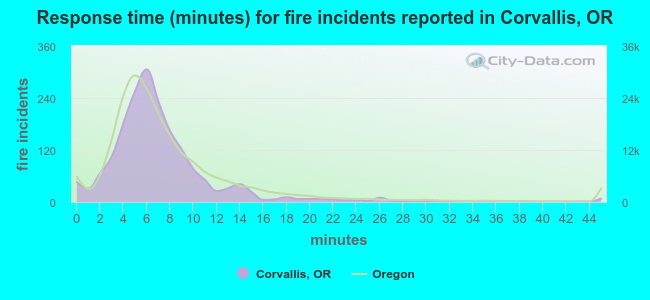 The median response time based on all reported fire incidents is 6 minutes. This is about the same as the state median value.
The median response time in Corvallis, OR compared to nearest cities:
(Note: Based on data for all years, including only cities with at least 500 fire incidents)
| Corvallis: | 6 minutes |
| Albany: | 6 minutes |
| Lebanon: | 6 minutes |
| Dallas: | 7 minutes |
| Junction City: | 9 minutes |
| Turner: | 10 minutes |
| Salem: | 5 minutes |
| Stayton: | 8 minutes |
| Sweet Home: | 7 minutes |
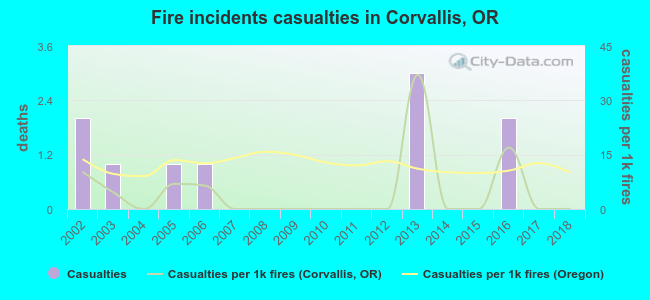 According to the data from the years 2002 - 2018 the average number of fire-related casualties per year is 1. The highest number of casualties - 3 took place in 2013, and the lowest - 0 in 2004. The data has a dropping trend.
The average number of injuries per 1,000 fire incidents is 5. This indicator was the highest - 37 in 2013, and the lowest 0 in 2004. The trend for casualties per 1,000 fire incidents is decreasing. Compared to the state value the number of casualties per 1,000 incidents is much lower.
According to the data from the years 2002 - 2018 the average number of fire-related casualties per year is 1. The highest number of casualties - 3 took place in 2013, and the lowest - 0 in 2004. The data has a dropping trend.
The average number of injuries per 1,000 fire incidents is 5. This indicator was the highest - 37 in 2013, and the lowest 0 in 2004. The trend for casualties per 1,000 fire incidents is decreasing. Compared to the state value the number of casualties per 1,000 incidents is much lower.Casualties per 1,000 incidents in Corvallis, OR compared to nearest cities:
(Note: Based on data for all years, including only cities with at least 500 fire incidents)
| Corvallis: | 5.4 |
| Albany: | 14.5 |
| Lebanon: | 24.2 |
| Dallas: | 9.1 |
| Junction City: | 7.4 |
| Turner: | 3.5 |
| Salem: | 22.6 |
| Stayton: | 23.3 |
| Sweet Home: | 20.6 |
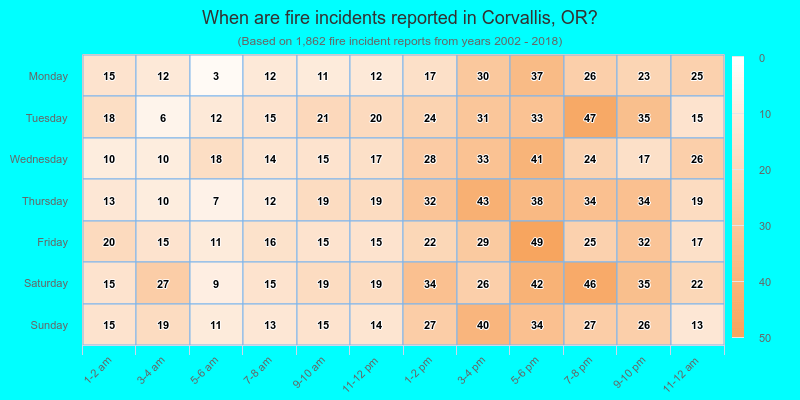
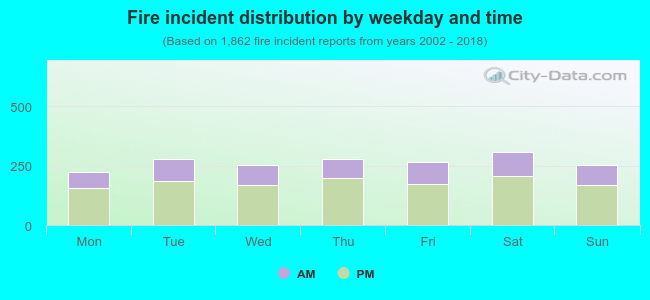 32.4% incidents where reported in the morning and 67.6% in the evening. The most fires (16.6%) took place on Saturday, and the least (12.0%) on Monday.
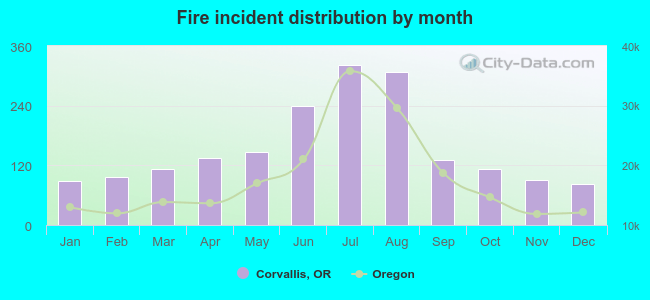 Based on the 1,862 reports from years 2002 - 2018 most fires (17.3%) took place during July, and the least (4.5%) in December.
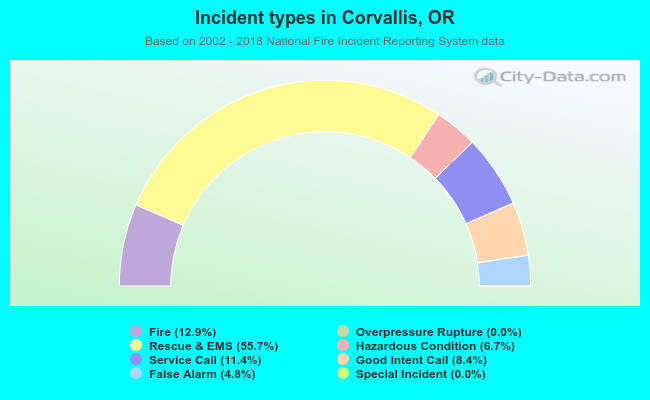 Out of all 14,436 cases reported during the years 2002 - 2018, the most belonged to the categories: Rescue & EMS (55.7%), Fire (12.9%), and Service Call (11.4%).
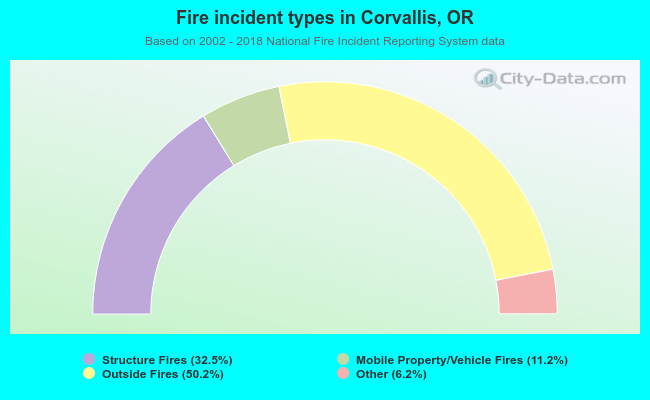 When looking into fire subcategories, the most incidents belonged to: Outside Fires (50.2%), and Structure Fires (32.5%).