Cortland: Fire Incidents, Illinois (IL)
Where are fire incidents reported in Cortland, IL
Something went wrong! Please refresh the page.
|
| |||||||||||||||||||||||||||||||||||||||||||||||||||||||||||||||||||||||||||||||||||||||||||||||||||||||||||||
2002 - 2018 National Fire Incident Reporting System (NFIRS) incidents
- Incident types reported to NFIRS in Cortland, IL
- 1,20957.7%Rescue & EMS
- 36017.2%Fire
- 2019.6%Hazardous Condition
- 1245.9%False Alarm
- 1105.3%Service Call
- 834.0%Good Intent Call
- 30.1%Overpressure Rupture
- 30.1%Severe Weather
- Fire incident types reported to NFIRS in Cortland, IL
- 18350.8%Structure Fires
- 9827.2%Outside Fires
- 5415.0%Mobile Property/Vehicle Fires
- 256.9%Other
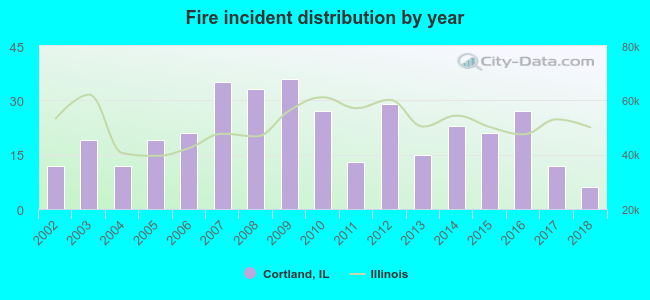 According to the data from the years 2002 - 2018 the average number of fire incidents per year is 21. The highest number of fires - 36 took place in 2009, and the least - 6 in 2018. The data has a decreasing trend.
 According to the data from the years 2002 - 2018 the average number of fire-related casualties per year is 0. The highest number of reported casualties - 2 took place in 2009, and the lowest - 0 in 2002. The data has a constant trend.
 31.7% incidents where reported in the morning and 68.3% in the evening. The most fires (17.2%) took place on Saturday, and the least (12.2%) on Tuesday.
 According to the 360 fire incidents from years 2002 - 2018 most fires (12.2%) took place during March, and the least (5.3%) in September.
 Out of all 2,095 cases reported during the years 2002 - 2018, the most belonged to the categories: Rescue & EMS (57.7%), Fire (17.2%), and Hazardous Condition (9.6%).
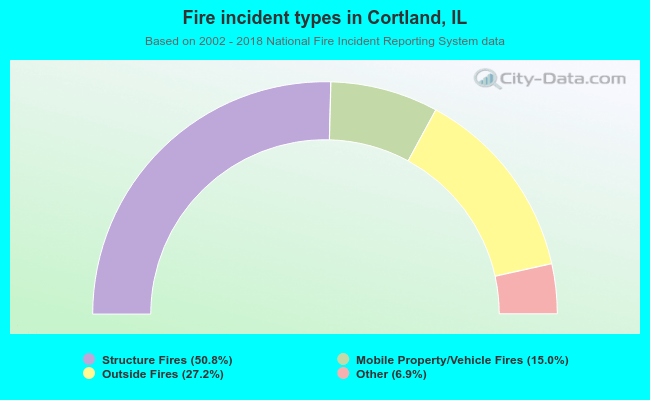 When looking into fire subcategories, the most incidents belonged to: Structure Fires (50.8%), and Outside Fires (27.2%).