Corpus Christi: Fire Incidents, Texas (TX)
Where are fire incidents reported in Corpus Christi, TX
Something went wrong! Please refresh the page.
| Fire incidents reported | |
|---|---|
| Sreet name | Count |
| PADRE ISLAND DR | 1,746 |
| LEOPARD ST | 1,062 |
| STAPLES ST | 726 |
| AYERS ST | 532 |
| ALAMEDA ST | 438 |
| EVERHART RD | 400 |
| WEBER RD | 398 |
| HWY 361 | 370 |
| AGNES ST | 356 |
| WALDRON RD | 356 |
| OCEAN DR | 326 |
| SARATOGA BLVD | 308 |
| UP RIVER RD | 308 |
| AIRLINE RD | 284 |
| 37 | 264 |
| KOSTORYZ RD | 252 |
| GREENWOOD DR | 250 |
| HOLLY RD | 220 |
| SUN TIDE RD | 208 |
| IH 37 ACCESS RD | 196 |
| OLD BROWNSVILLE RD | 196 |
| PORT AVE | 196 |
| YORKTOWN BLVD | 186 |
| IH 37 FWY | 184 |
| GOLLIHAR RD | 172 |
| HORNE RD | 162 |
| NUECES BAY BLVD | 152 |
| WALDRON | 150 |
| ANTELOPE ST | 134 |
| FLOUR BLUFF DR | 132 |
| Other | 9,465 |
2002 - 2018 National Fire Incident Reporting System (NFIRS) incidents
- Incident types reported to NFIRS in Corpus Christi, TX
- 177,42868.0%Rescue & EMS
- 23,9169.2%Good Intent Call
- 20,1297.7%Fire
- 17,9076.9%Hazardous Condition
- 11,5324.4%Service Call
- 9,6003.7%False Alarm
- 2890.1%Special Incident
- Fire incident types reported to NFIRS in Corpus Christi, TX
- 9,09145.2%Outside Fires
- 5,90329.3%Structure Fires
- 3,74618.6%Mobile Property/Vehicle Fires
- 1,3896.9%Other
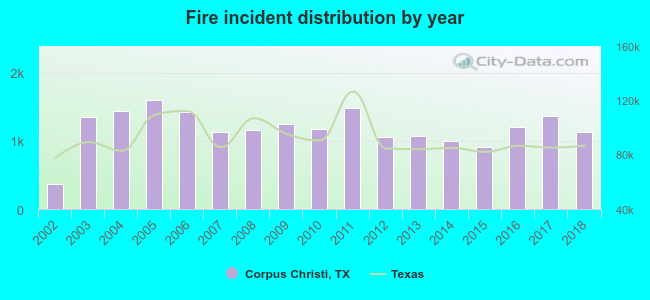 Based on the data from the years 2002 - 2018 the average number of fire incidents per year is 1,184. The highest number of fire incidents - 1,594 took place in 2005, and the least - 374 in 2002. The data has an increasing trend.
The average number of yearly fire incidents per 10k residents in Corpus Christi, TX compared to nearest cities:
(Note: Based on data for the last 3 years, including only cities with population 5,000 and above)
| Corpus Christi: | 38.5 |
| Portland: | 26.2 |
| Ingleside: | 59.1 |
| Robstown: | 106.1 |
| Aransas Pass: | 93.0 |
| Sinton: | 18.6 |
| Rockport: | 82.0 |
| Kingsville: | 32.0 |
| Mathis: | 5.3 |
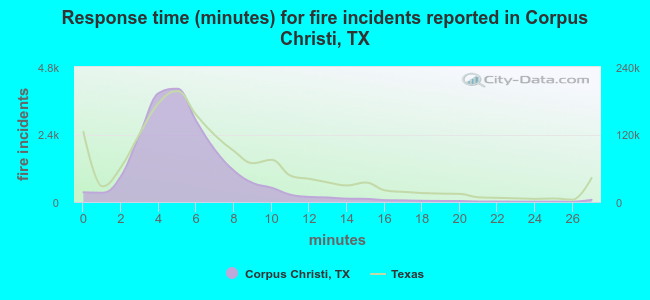 The median response time based on all reported fire incidents is 5 minutes. This is lower than the Texas median value.
The median response time in Corpus Christi, TX compared to nearest cities:
(Note: Based on data for all years, including only cities with at least 500 fire incidents)
| Corpus Christi: | 5 minutes |
| Portland: | 5 minutes |
| Ingleside: | 5 minutes |
| Taft: | 10 minutes |
| Robstown: | 5 minutes |
| Aransas Pass: | 5 minutes |
| Rockport: | 7 minutes |
| Kingsville: | 4 minutes |
| Refugio: | 10 minutes |
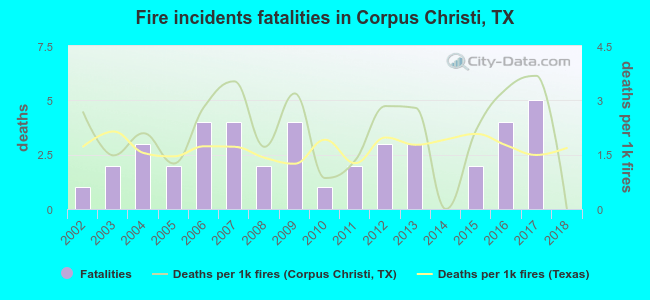 According to the reports from the years 2002 - 2018 the average number of fire-related yearly deaths is 2. The highest number of deaths - 5 took place in 2017, and the lowest - 0 in 2014. The data has a decreasing trend.
The average number of fatalities per 1,000 fire incidents is 2. This indicator was the highest - 4 in 2017, and the lowest 0 in 2014. The trend for fatalities per 1,000 incidents is dropping. Compared to the state value the number of fatalities per 1,000 fires is higher.
According to the reports from the years 2002 - 2018 the average number of fire-related yearly deaths is 2. The highest number of deaths - 5 took place in 2017, and the lowest - 0 in 2014. The data has a decreasing trend.
The average number of fatalities per 1,000 fire incidents is 2. This indicator was the highest - 4 in 2017, and the lowest 0 in 2014. The trend for fatalities per 1,000 incidents is dropping. Compared to the state value the number of fatalities per 1,000 fires is higher.Deaths per 1,000 incidents in Corpus Christi, TX compared to nearest cities:
(Note: Based on data for all years, including only cities with at least 2,500 fire incidents)
| Corpus Christi: | 2.1 |
| Alice: | 0.6 |
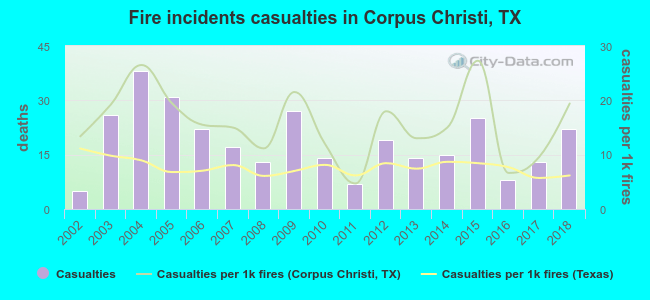 Based on the data from the years 2002 - 2018 the average number of fire-related casualties per year is 19. The highest number of injuries - 38 took place in 2004, and the lowest - 5 in 2002. The data has an increasing trend.
The average number of casualties per 1,000 fires is 16. This indicator was the highest - 27 in 2015, and the lowest 5 in 2011. The trend for casualties per 1,000 incidents is rising. Compared to the Texas value the number of casualties per 1,000 fires is much higher.
Based on the data from the years 2002 - 2018 the average number of fire-related casualties per year is 19. The highest number of injuries - 38 took place in 2004, and the lowest - 5 in 2002. The data has an increasing trend.
The average number of casualties per 1,000 fires is 16. This indicator was the highest - 27 in 2015, and the lowest 5 in 2011. The trend for casualties per 1,000 incidents is rising. Compared to the Texas value the number of casualties per 1,000 fires is much higher.Casualties per 1,000 incidents in Corpus Christi, TX compared to nearest cities:
(Note: Based on data for all years, including only cities with at least 500 fire incidents)
| Corpus Christi: | 15.7 |
| Portland: | 4.3 |
| Ingleside: | 5.2 |
| Taft: | 0.0 |
| Robstown: | 1.4 |
| Aransas Pass: | 0.0 |
| Rockport: | 4.3 |
| Kingsville: | 8.4 |
| Refugio: | 1.9 |
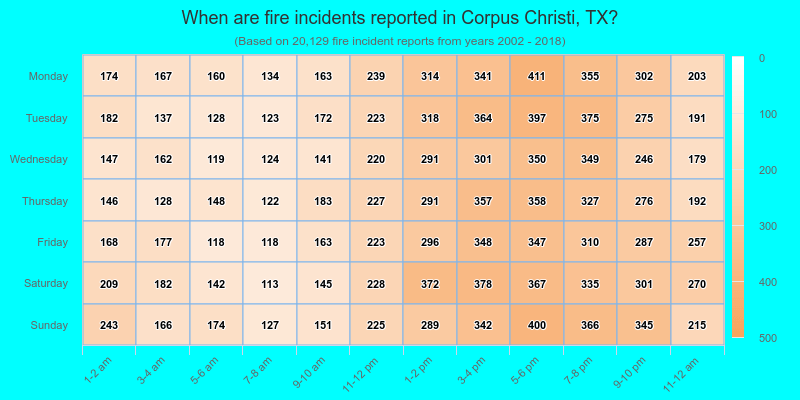
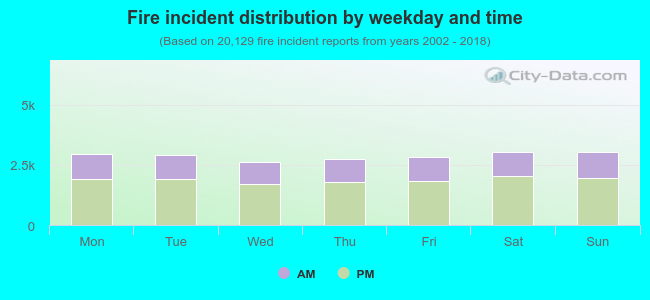 34.5% incidents where reported in the morning and 65.5% in the evening. The most fires (15.1%) took place on Sunday, and the least (13.1%) on Wednesday.
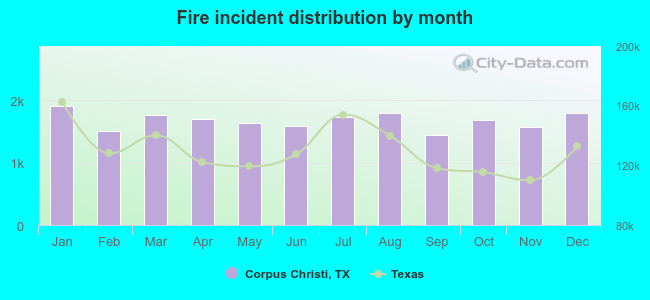 According to the 20,129 fire incidents from years 2002 - 2018 most fires (9.5%) took place during January, and the least (7.2%) in September.
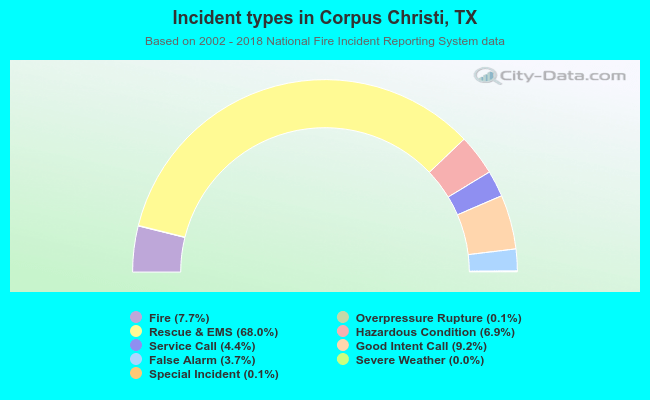 Out of all 261,046 cases reported during the years 2002 - 2018, the most belonged to the categories: Rescue & EMS (68.0%), Good Intent Call (9.2%), and Fire (7.7%).
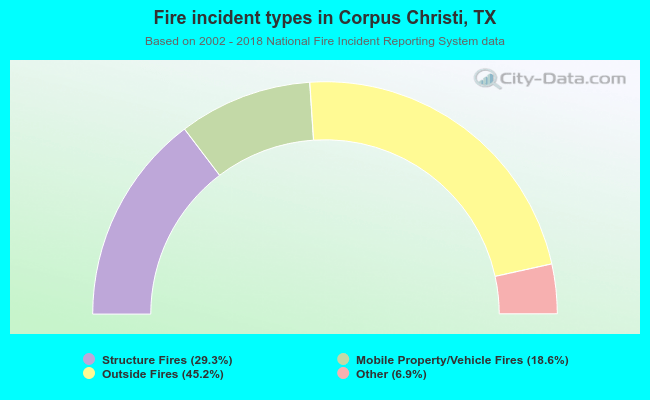 When looking into fire subcategories, the most incidents belonged to: Outside Fires (45.2%), and Structure Fires (29.3%).