| Fire incidents reported |
|---|
| Sreet name | Count |
|---|
| INTERSTATE 65 | 62 | | OSTELLA RD | 38 | | DELINA RD | 26 | | I-65 | 16 | | PULASKI HWY | 14 | | MAIN ST | 12 | | COOSIE BRANCH RD | 10 | | JOHN BARNES RD | 10 | | LYNNVILLE HWY | 10 | | COOSIE BRANCH RD | 8 | | CORNERSVILLE HWY | 8 | | EBENEZER HOLLOW RD | 8 | | LONDON RD | 8 | | NEW OSTELLA RD | 8 | | 208 OSTELLA RD | 6 | | CARL FOX RD | 6 | | COLEMAN RD | 6 | | COLEMAN RD | 6 | | COLEMAN ROAD | 6 | | CORNERSVILLE HWY | 6 | | HATCHETT HOLLOW RD | 6 | | INTERSTATE 65 HWY | 6 | | LYNNVILLE HWY | 6 | | OSTELLA ROAD | 6 | | TRIGG CITY RD | 6 |
| | | Fire incidents reported |
|---|
| Sreet name | Count |
|---|
| TURKEY MCCOLLUM RD | 6 | | 121 BEECHWOOD AVE | 4 | | 129 HWY | 4 | | 1312 POOR HOUSE RD | 4 | | 1803 LYNNVILLE HWY | 4 | | 2781 LYNNVILLE HWY | 4 | | 2987 PULASKI HWY | 4 | | 3018 OSTELLA RD | 4 | | BLUE CREEK RD | 4 | | CHARLIE THOMAS RD | 4 | | CHEEK RD | 4 | | CHEEK RD | 4 | | COOSIE BRANCH | 4 | | COOSIE BRANCH ROAD | 4 | | COWSER RD | 4 | | COWSER ROAD | 4 | | DIANA RD | 4 | | DUBOSE LN | 4 | | FAIRVIEW AVE | 4 | | HWY 129 | 4 | | I65 | 4 | | JOHN BARNES RD | 4 | | JOHN BARNES ROAD | 4 | | LONDON RD | 4 | | |
|
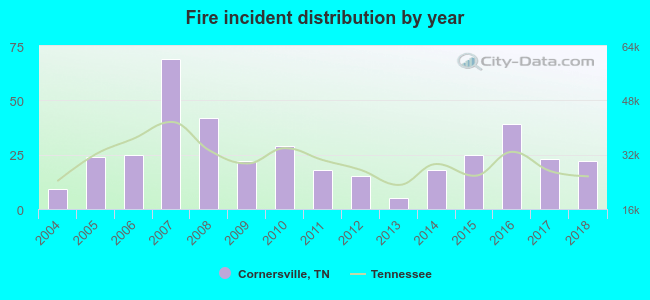 According to the data from the years 2004 - 2018 the average number of fires per year is 26. The highest number of fires - 69 took place in 2007, and the least - 5 in 2013. The data has an increasing trend.
 28.8% incidents where reported in the morning and 71.2% in the evening. The most fires (17.9%) took place on Friday, and the least (11.2%) on Wednesday.
 According to the 385 fire incident reports from years 2004 - 2018 most fires (11.9%) took place during March, and the least (4.9%) in June.
 Out of all 716 cases reported during the years 2004 - 2018, the most belonged to the categories: Fire (53.8%), Rescue & EMS (18.7%), and Good Intent Call (11.2%).
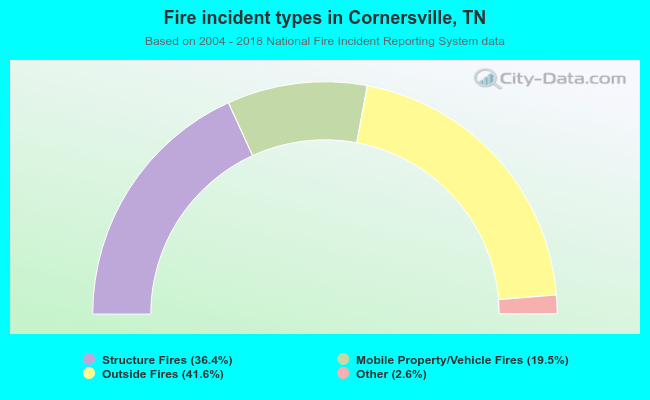 When looking into fire subcategories, the most incidents belonged to: Outside Fires (41.6%), and Structure Fires (36.4%).