Cordova: Fire Incidents, Illinois (IL)
Where are fire incidents reported in Cordova, IL
Something went wrong! Please refresh the page.
|
| |||||||||||||||||||||||||||||||||||||||||||||||||||||||||||||||||||||||||||||||||||||||||||||||||||||||||||||
2002 - 2018 National Fire Incident Reporting System (NFIRS) incidents
- Incident types reported to NFIRS in Cordova, IL
- 39849.3%Rescue & EMS
- 26032.2%Fire
- 8110.0%Hazardous Condition
- 283.5%Service Call
- 243.0%Good Intent Call
- 111.4%False Alarm
- 30.4%Overpressure Rupture
- 20.2%Severe Weather
- 10.1%Special Incident
- Fire incident types reported to NFIRS in Cordova, IL
- 10038.5%Outside Fires
- 7930.4%Structure Fires
- 6123.5%Other
- 207.7%Mobile Property/Vehicle Fires
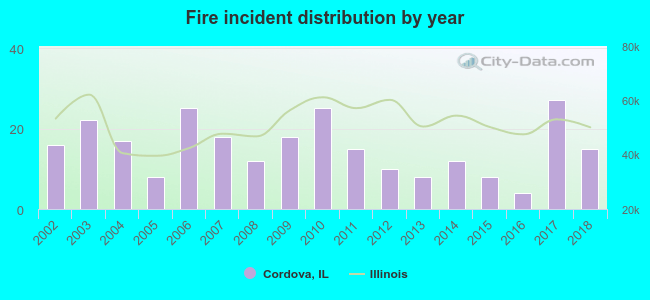 According to the data from the years 2002 - 2018 the average number of fire incidents per year is 15. The highest number of fires - 27 took place in 2017, and the least - 4 in 2016. The data has a decreasing trend.
 25.0% incidents where reported in the morning and 75.0% in the evening. The most fires (16.9%) took place on Tuesday, and the least (11.2%) on Monday.
 According to the 260 fires from years 2002 - 2018 most fires (19.6%) took place during April, and the least (4.2%) in December.
 Out of all 808 cases reported during the years 2002 - 2018, the most belonged to the categories: Rescue & EMS (49.3%), Fire (32.2%), and Hazardous Condition (10.0%).
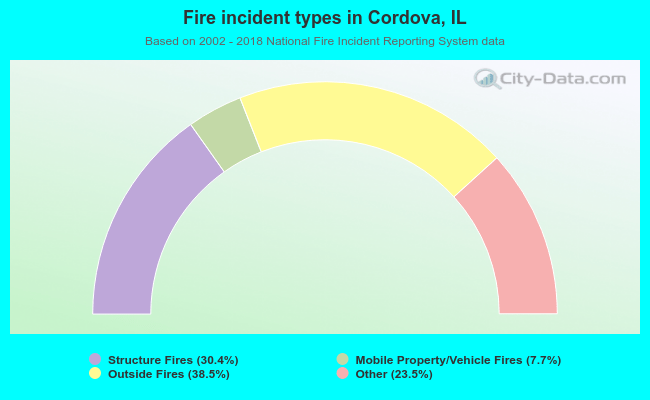 When looking into fire subcategories, the most incidents belonged to: Outside Fires (38.5%), and Structure Fires (30.4%).