Copper Mountain: Fire Incidents, Colorado (CO)
Where are fire incidents reported in Copper Mountain, CO
Something went wrong! Please refresh the page.
|
| |||||||||||||||||||||||||||||||||||||||||||||||||||||||||||||||||||||||||||||||||||||||||||||
2003 - 2018 National Fire Incident Reporting System (NFIRS) incidents
- Incident types reported to NFIRS in Copper Mountain, CO
- 1,27743.9%Rescue & EMS
- 62721.5%False Alarm
- 39113.4%Good Intent Call
- 2679.2%Hazardous Condition
- 1836.3%Fire
- 1595.5%Service Call
- 40.1%Overpressure Rupture
- Fire incident types reported to NFIRS in Copper Mountain, CO
- 8445.9%Structure Fires
- 4323.5%Mobile Property/Vehicle Fires
- 3619.7%Outside Fires
- 2010.9%Other
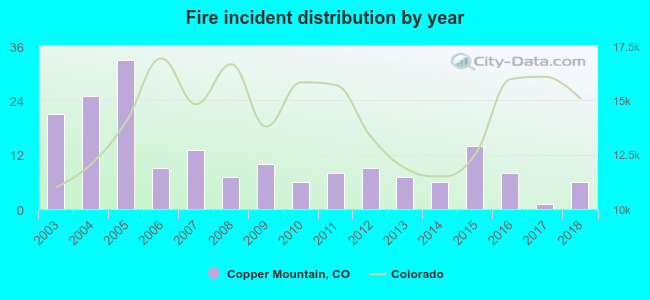 According to the data from the years 2003 - 2018 the average number of fire incidents per year is 11. The highest number of fire incidents - 33 took place in 2005, and the least - 1 in 2017. The data has a dropping trend.
 36.1% incidents where reported in the morning and 63.9% in the evening. The most fires (24.6%) took place on Saturday, and the least (9.3%) on Friday.
 Based on the 183 fire incidents from years 2003 - 2018 most fires (15.8%) took place during January, and the least (2.7%) in May.
 Out of all 2,911 cases reported during the years 2003 - 2018, the most belonged to the categories: Rescue & EMS (43.9%), False Alarm (21.5%), and Good Intent Call (13.4%).
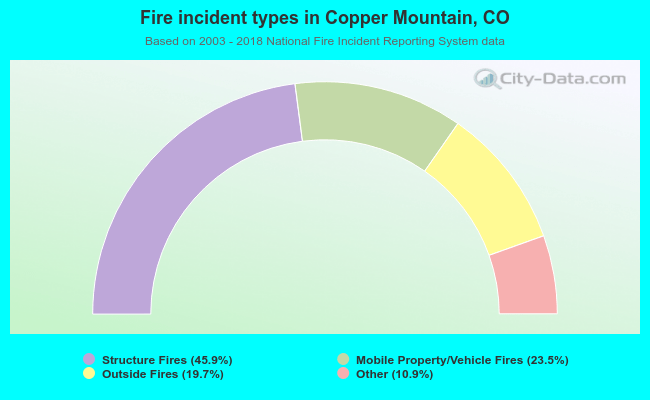 When looking into fire subcategories, the most incidents belonged to: Structure Fires (45.9%), and Mobile Property/Vehicle Fires (23.5%).