Conklin: Fire Incidents, New York (NY)
Where are fire incidents reported in Conklin, NY
Something went wrong! Please refresh the page.
|
| |||||||||||||||||||||||||||||||||||||||||||||||||||||||||||||||||||||||||||||||||||||||||||||||||||||||||||||
2002 - 2018 National Fire Incident Reporting System (NFIRS) incidents
- Incident types reported to NFIRS in Conklin, NY
- 43326.1%Rescue & EMS
- 41525.0%Hazardous Condition
- 38623.3%Fire
- 22313.4%False Alarm
- 965.8%Service Call
- 955.7%Good Intent Call
- 70.4%Severe Weather
- 20.1%Special Incident
- Fire incident types reported to NFIRS in Conklin, NY
- 17846.1%Structure Fires
- 14036.3%Outside Fires
- 4311.1%Mobile Property/Vehicle Fires
- 256.5%Other
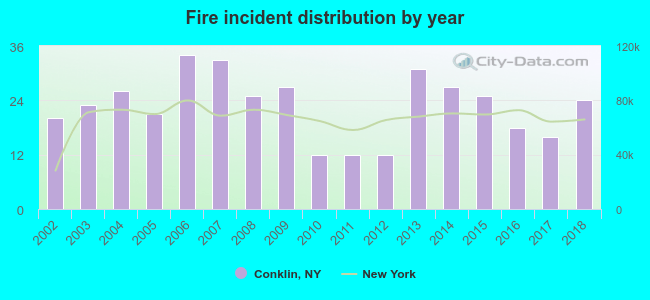 Based on the data from the years 2002 - 2018 the average number of fires per year is 23. The highest number of reported fires - 34 took place in 2006, and the least - 12 in 2010. The data has an increasing trend.
The average number of yearly fire incidents per 10k residents in Conklin, NY compared to nearest cities:
(Note: Based on data for the last 3 years, including only cities with population 5,000 and above)
| Conklin: | 35.5 |
| Kirkwood: | 20.5 |
| Binghamton: | 52.5 |
| Dickinson: | 5.7 |
| Johnson City: | 42.9 |
| Fenton: | 1.5 |
| Vestal: | 21.3 |
| Union: | 1.5 |
| Endwell: | 21.3 |

 35.2% incidents where reported in the morning and 64.8% in the evening. The most fires (19.2%) took place on Sunday, and the least (11.9%) on Monday.
 According to the 386 fire incident reports from years 2002 - 2018 most fires (19.2%) took place during April, and the least (3.6%) in December.
 Out of all 1,658 cases reported during the years 2002 - 2018, the most belonged to the categories: Rescue & EMS (26.1%), Hazardous Condition (25.0%), and Fire (23.3%).
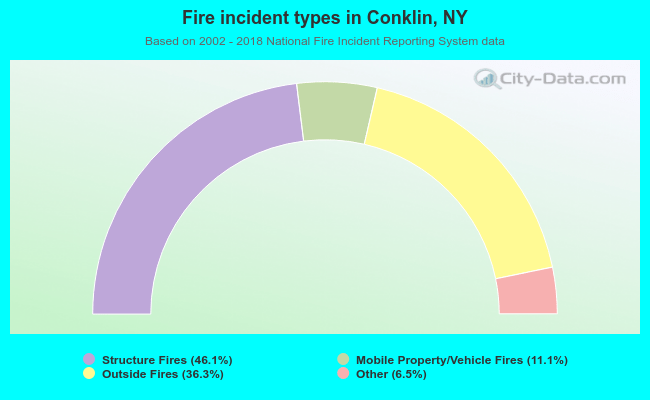 When looking into fire subcategories, the most incidents belonged to: Structure Fires (46.1%), and Outside Fires (36.3%).