| Fire incidents reported |
|---|
| Sreet name | Count |
|---|
| MAIN ST | 70 | | RIVER RD | 70 | | MAIN ST | 36 | | RIVER RD | 34 | | CHESTNUT GROVE RD | 32 | | CHESTNUT GROVE RD | 28 | | KENDIG RD | 18 | | RIVER ROAD | 18 | | STONE HILL RD | 16 | | MAIN STREET | 14 | | HILLTOP DR | 12 | | SHENKS FERRY RD | 12 | | BOY SCOUT RD | 10 | | BOY SCOUT RD | 10 | | HIGHVILLE RD | 10 | | HIGHVILLE RD | 10 | | INDIAN MARKER RD | 10 | | OAK RD | 10 | | OBSERVATION RD | 10 | | ELM ST | 8 | | INDIAN MARKER RD | 8 | | INDIAN RUN RD | 8 | | LONG LN | 8 | | OAK RD | 8 | | RIVER CORNER RD | 8 |
| | | Fire incidents reported |
|---|
| Sreet name | Count |
|---|
| BRENEMAN RD | 6 | | BRENNEMAN RD | 6 | | DUCK HILL RD | 6 | | ORCHARD LN | 6 | | RIVER HILL RD | 6 | | SAFE HARBOR RD | 6 | | SAFE HARBOR RD | 6 | | SHENKS FERRY RD | 6 | | SLACKWATER RD | 6 | | SLACKWATER RD | 6 | | STONE HILL RD | 6 | | SUSQUEHANNA RIVER | 6 | | WALNUT HILL RD | 6 | | CHESNUT GROVE RD | 4 | | COLEMANVILLE CHURCH RD | 4 | | COLEMANVILLE RD | 4 | | CREEK RD | 4 | | FOX HOLLOW RD | 4 | | HILLTOP DR | 4 | | INDIAN RUN RD | 4 | | LONG LN | 4 | | PEQUEA BLVD | 4 | | PEQUEA CREEK RD | 4 | | PEQUEA LANE | 4 | | |
|
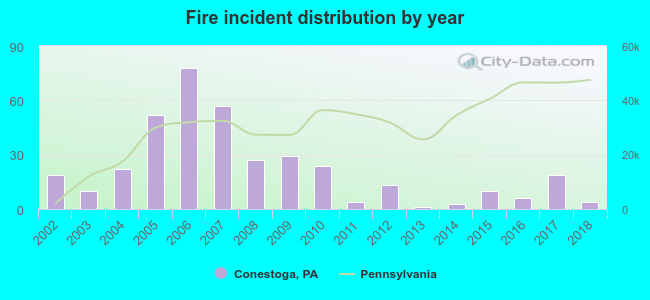 Based on the data from the years 2002 - 2018 the average number of fires per year is 22. The highest number of fire incidents - 78 took place in 2006, and the least - 1 in 2013. The data has a declining trend.
 38.4% incidents where reported in the morning and 61.6% in the evening. The most fires (21.2%) took place on Saturday, and the least (9.8%) on Thursday.
 Based on the 378 reports from years 2002 - 2018 most fires (14.0%) took place during January, and the least (3.2%) in May.
 Out of all 872 cases reported during the years 2002 - 2018, the most belonged to the categories: Fire (43.3%), Rescue & EMS (18.1%), and Service Call (17.5%).
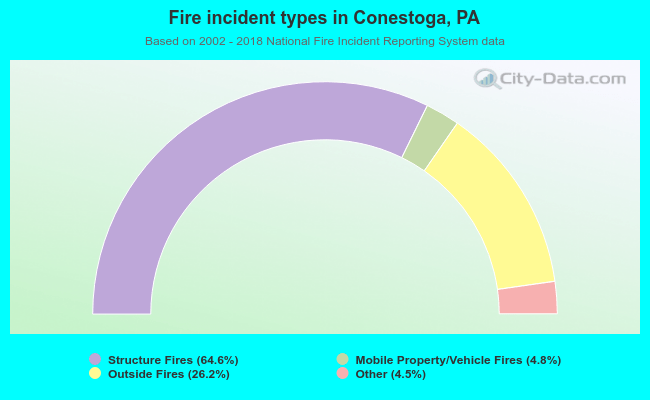 When looking into fire subcategories, the most reports belonged to: Structure Fires (64.6%), and Outside Fires (26.2%).