Columbus: Fire Incidents, Wisconsin (WI)
Where are fire incidents reported in Columbus, WI
Something went wrong! Please refresh the page.
|
| |||||||||||||||||||||||||||||||||||||||||||||||||||||||||||||||||||||||||||||||||||||||||||||||||||||||||||||
| Other | 95 | |||||||||||||||||||||||||||||||||||||||||||||||||||||||||||||||||||||||||||||||||||||||||||||||||||||||||||||
2002 - 2018 National Fire Incident Reporting System (NFIRS) incidents
- Incident types reported to NFIRS in Columbus, WI
- 49533.5%Fire
- 34323.2%Rescue & EMS
- 28619.4%Hazardous Condition
- 1399.4%False Alarm
- 1127.6%Good Intent Call
- 805.4%Service Call
- 130.9%Overpressure Rupture
- 70.5%Severe Weather
- 20.1%Special Incident
- Fire incident types reported to NFIRS in Columbus, WI
- 19539.4%Structure Fires
- 17234.7%Outside Fires
- 9018.2%Mobile Property/Vehicle Fires
- 387.7%Other
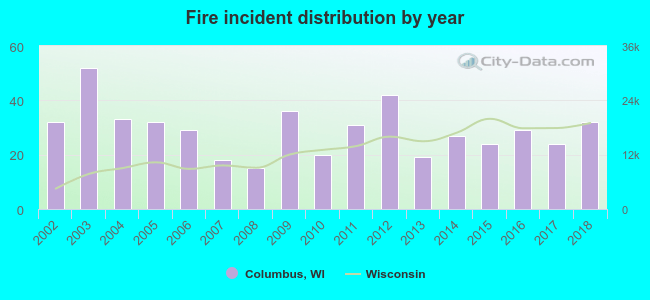 Based on the data from the years 2002 - 2018 the average number of fires per year is 29. The highest number of fires - 52 took place in 2003, and the least - 15 in 2008. The data has a constant trend.
 According to the data from the years 2002 - 2018 the average number of fire-related casualties per year is 0. The highest number of injuries - 1 took place in 2005, and the lowest - 0 in 2002. The data has a constant trend.
 31.5% incidents where reported in the morning and 68.5% in the evening. The most fires (18.0%) took place on Thursday, and the least (10.7%) on Sunday.
 According to the 495 reports from years 2002 - 2018 most fires (17.6%) took place during April, and the least (4.4%) in December.
 Out of all 1,477 cases reported during the years 2002 - 2018, the most belonged to the categories: Fire (33.5%), Rescue & EMS (23.2%), and Hazardous Condition (19.4%).
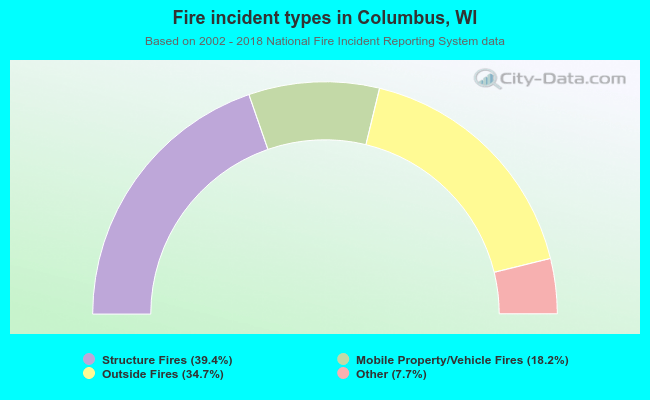 When looking into fire subcategories, the most incidents belonged to: Structure Fires (39.4%), and Outside Fires (34.7%).