Columbus Grove: Fire Incidents, Ohio (OH)
Where are fire incidents reported in Columbus Grove, OH
Something went wrong! Please refresh the page.
|
| |||||||||||||||||||||||||||||||||||||||||||||||||||||||||||||||||||||||||||||||||||||||||||||||||||||||||||||
2003 - 2018 National Fire Incident Reporting System (NFIRS) incidents
- Incident types reported to NFIRS in Columbus Grove, OH
- 45249.7%Fire
- 18820.7%Rescue & EMS
- 14816.3%Hazardous Condition
- 566.2%Good Intent Call
- 323.5%Service Call
- 222.4%False Alarm
- 50.6%Special Incident
- 40.4%Severe Weather
- 20.2%Overpressure Rupture
- Fire incident types reported to NFIRS in Columbus Grove, OH
- 20946.2%Outside Fires
- 18841.6%Structure Fires
- 5512.2%Mobile Property/Vehicle Fires
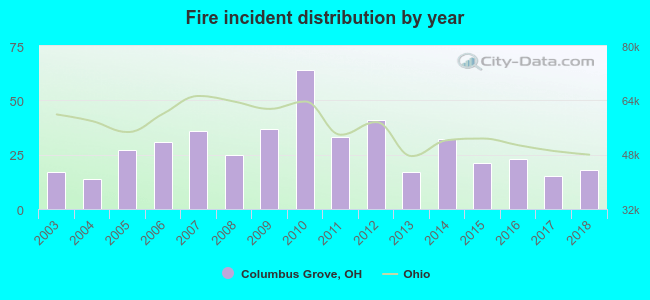 According to the data from the years 2003 - 2018 the average number of fires per year is 28. The highest number of fires - 64 took place in 2010, and the least - 14 in 2004. The data has an increasing trend.
 According to the reports from the years 2003 - 2018 the average number of fire-related casualties per year is 0. The highest number of injuries - 2 took place in 2007, and the lowest - 0 in 2003. The data has a constant trend.
 25.0% incidents where reported in the morning and 75.0% in the evening. The most fires (17.5%) took place on Thursday, and the least (12.2%) on Wednesday.
 Based on the 452 fire incident reports from years 2003 - 2018 most fires (13.9%) took place during April, and the least (3.1%) in December.
 Out of all 909 cases reported during the years 2003 - 2018, the most belonged to the categories: Fire (49.7%), Rescue & EMS (20.7%), and Hazardous Condition (16.3%).
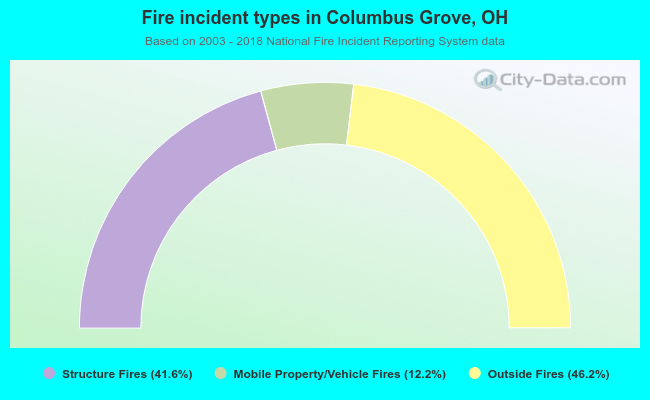 When looking into fire subcategories, the most reports belonged to: Outside Fires (46.2%), and Structure Fires (41.6%).