| Fire incidents reported |
|---|
| Sreet name | Count |
|---|
| WAWAWAI RD | 42 | | BECKER RD | 10 | | WAWAWAII RD | 10 | | KOPF RD | 8 | | WAWAWAI RIVER RD | 8 | | RIMROCK RD | 6 | | SR 195 HWY | 6 | | WAWAWAI RD | 6 | | WAWAWAI-PULLMAN RD | 6 | | 1001 BROADWAY ST | 4 | | 13402 SR 195 | 4 | | BALD BUTTE RD | 4 | | BROADWAY ST | 4 | | JOHNSON RD | 4 | | JOHNSON RD | 4 | | MARTIN DRUFFEL RD | 4 | | 1001 BALD BUTTE RD | 2 | | 11061 WAWAWAI RD | 2 | | 111 STEPTO ST | 2 | | 11601 WAWAWAI RD | 2 | | 1211 ESSER RD | 2 | | 13352 SR195 | 2 | | 14301 WAWAWAI LRD | 2 | | 18000 WAWAWAI RD | 2 | | 202 RON DRUFFEL RD | 2 |
| | | Fire incidents reported |
|---|
| Sreet name | Count |
|---|
| 22001 WAWAWAI RD | 2 | | 2401 BAKER RD | 2 | | 26068 WAWAWAI RD | 2 | | 306 STEPTO ST | 2 | | 3322 RIMROCK RD | 2 | | 3343 RIMROCK RD | 2 | | 408 EAST CHURCH ST LGTS | 2 | | 4302 UNION FLAT RD | 2 | | 4702 WAWAWAI RD | 2 | | 5600 WAWAWAI RD | 2 | | 601 LAKE STRE | 2 | | 601 N MEYER RD | 2 | | 6902 SR 195 | 2 | | 7202 JOHNSON RD | 2 | | 7651 JOHNSON RD | 2 | | 8091 JOHNSON RD | 2 | | 901 DUNNING RD | 2 | | 959 BOONE HILL RD | 2 | | 9751 JOHNSON RD | 2 | | BALD BUTTE RD | 2 | | CHURCH ST | 2 | | D MEYER RD | 2 | | DEPOT ST | 2 | | GRANITE POINT | 2 | | |
|
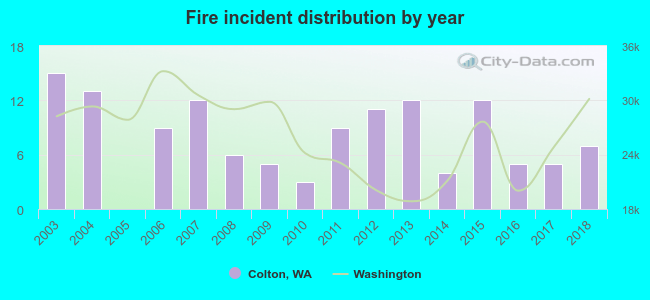 Based on the data from the years 2003 - 2018 the average number of fires per year is 8. The highest number of fire incidents - 15 took place in 2003, and the least - 0 in 2005. The data has a decreasing trend.
 20.3% incidents where reported in the morning and 79.7% in the evening. The most fires (18.0%) took place on Monday, and the least (7.0%) on Sunday.
 According to the 128 fire incident reports from years 2003 - 2018 most fires (25.0%) took place during August, and the least (1.6%) in February.
 Out of all 258 cases reported during the years 2003 - 2018, the most belonged to the categories: Fire (49.6%), Overpressure Rupture (36.4%), and Hazardous Condition (4.3%).
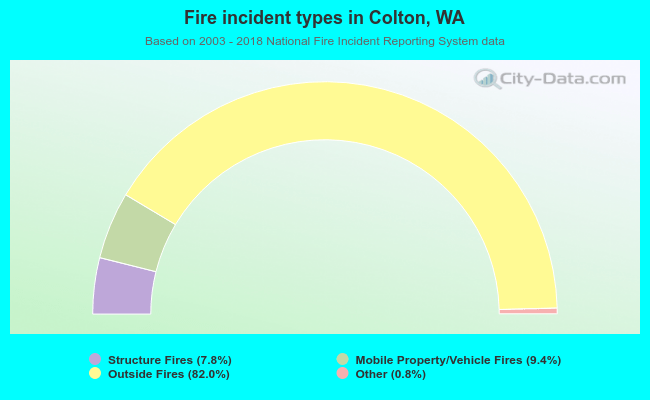 When looking into fire subcategories, the most reports belonged to: Outside Fires (82.0%), and Mobile Property/Vehicle Fires (9.4%).