| Fire incidents reported |
|---|
| Sreet name | Count |
|---|
| MT OLIVE ST | 24 | | MADISON ST | 12 | | ANDREW SPRINGS DR | 10 | | JOHNSON STREET ST | 10 | | KENNEDY ST | 10 | | MAYOR CALIPER DR | 10 | | JOHNSON ST | 8 | | DAVIS ST | 6 | | MARTIN LUTHER KING DRIVE DR | 6 | | MT. OLIVE STREET ST | 6 | | 2ND ST | 4 | | 8TH ST | 4 | | COLP ST | 4 | | DAVIS STREET ST | 4 | | DR. SPRINGS ROAD RD | 4 | | GARFIELD STREET ST | 4 | | HERRIN RD | 4 | | HERRIN ROAD | 4 | | JACKSON AVE AVE | 4 | | LINCOLN ST | 4 | | M L KING STREET ST | 4 | | M. L. KING STREET ST | 4 | | MAYOR CALIPER RD | 4 | | MT. OLIVE | 4 | | SECOND ST | 4 |
| | | Fire incidents reported |
|---|
| Sreet name | Count |
|---|
| TAYLOR AVE | 4 | | 101 6TH ST | 2 | | 103 N JOHNSON | 2 | | 106 2ND ST | 2 | | 10TH STREET | 2 | | 12TH ST | 2 | | 201 N MAYOR CALIPER | 2 | | 2ND | 2 | | 2ND AT LINCOLN | 2 | | 2ND STREET | 2 | | 3 RD ST | 2 | | 301 MADISON ST. | 2 | | 307 M.L. KING ST | 2 | | 3455 DR SPRINGS | 2 | | 3RD | 2 | | 3RD ST | 2 | | 420 N MAYOR CALIPER | 2 | | 4TH ST | 2 | | 9 | 2 | | 9TH ST | 2 | | ANDREW SPRINGS | 2 | | ANDREW SPRINGS AND GARFIELD | 2 | | ANDREW SPRINGS RD | 2 | | CALIPER | 2 | | |
|
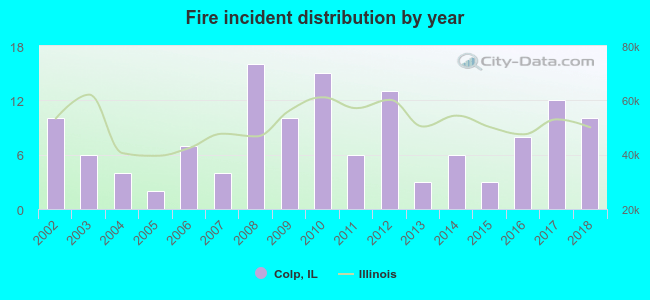 According to the data from the years 2002 - 2018 the average number of fire incidents per year is 8. The highest number of fires - 16 took place in 2008, and the least - 2 in 2005. The data has a constant trend.
 38.5% incidents where reported in the morning and 61.5% in the evening. The most fires (21.5%) took place on Tuesday, and the least (7.4%) on Saturday.
 Based on the 135 incident reports from years 2002 - 2018 most fires (11.9%) took place during January, and the least (3.0%) in July.
 Out of all 213 cases reported during the years 2002 - 2018, the most belonged to the categories: Fire (63.4%), Rescue & EMS (10.3%), and Hazardous Condition (9.9%).
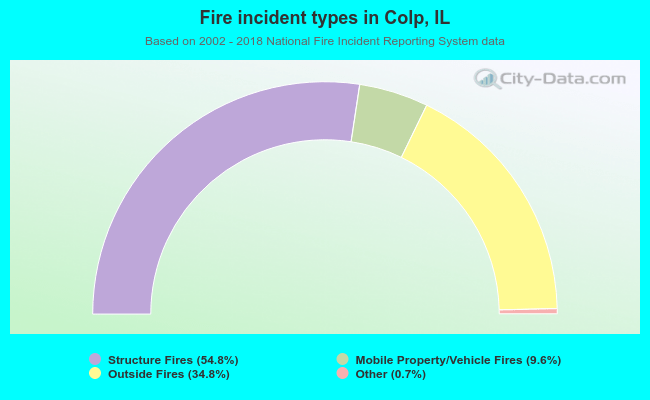 When looking into fire subcategories, the most incidents belonged to: Structure Fires (54.8%), and Outside Fires (34.8%).