Collins: Fire Incidents, Mississippi (MS)
Where are fire incidents reported in Collins, MS
Something went wrong! Please refresh the page.
|
| |||||||||||||||||||||||||||||||||||||||||||||||||||||||||||||||||||||||||||||||||||||||||||||||||||||||||||||
| Other | 1,009 | |||||||||||||||||||||||||||||||||||||||||||||||||||||||||||||||||||||||||||||||||||||||||||||||||||||||||||||
2002 - 2018 National Fire Incident Reporting System (NFIRS) incidents
- Incident types reported to NFIRS in Collins, MS
- 2,03147.5%Fire
- 1,35731.7%Rescue & EMS
- 3849.0%Hazardous Condition
- 3037.1%Good Intent Call
- 962.2%Service Call
- 821.9%False Alarm
- 170.4%Severe Weather
- 50.1%Special Incident
- Fire incident types reported to NFIRS in Collins, MS
- 1,04151.3%Outside Fires
- 69834.4%Structure Fires
- 26413.0%Mobile Property/Vehicle Fires
- 281.4%Other
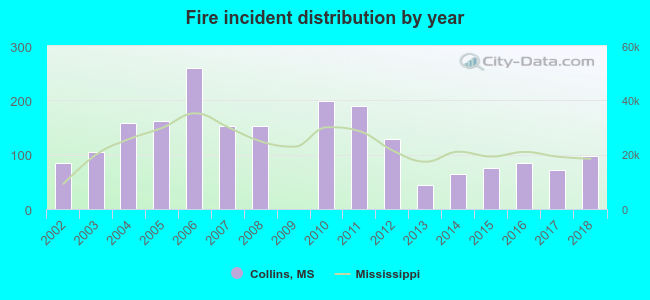 According to the data from the years 2002 - 2018 the average number of fire incidents per year is 119. The highest number of fires - 259 took place in 2006, and the least - 0 in 2009. The data has a rising trend.
 The median response time based on all reported fire incidents is 9 minutes. This is higher compared to the state median value.
The median response time in Collins, MS compared to nearest cities:
(Note: Based on data for all years, including only cities with at least 500 fire incidents)
| Collins: | 9 minutes |
| Seminary: | 9 minutes |
| Bassfield: | 5 minutes |
| Taylorsville: | 10 minutes |
| Sumrall: | 9 minutes |
| Soso: | 13 minutes |
| Prentiss: | 10 minutes |
| Magee: | 10 minutes |
| Ellisville: | 9 minutes |
 According to the reports from the years 2002 - 2018 the average number of fire-related yearly deaths is 0. The highest number of reported deaths - 2 took place in 2002, and the lowest - 0 in 2003. The data has a declining trend.
 33.9% incidents where reported in the morning and 66.1% in the evening. The most fires (17.3%) took place on Saturday, and the least (13.1%) on Tuesday.
 According to the 2,031 reports from years 2002 - 2018 most fires (11.0%) took place during October, and the least (6.3%) in August.
 Out of all 4,277 cases reported during the years 2002 - 2018, the most belonged to the categories: Fire (47.5%), Rescue & EMS (31.7%), and Hazardous Condition (9.0%).
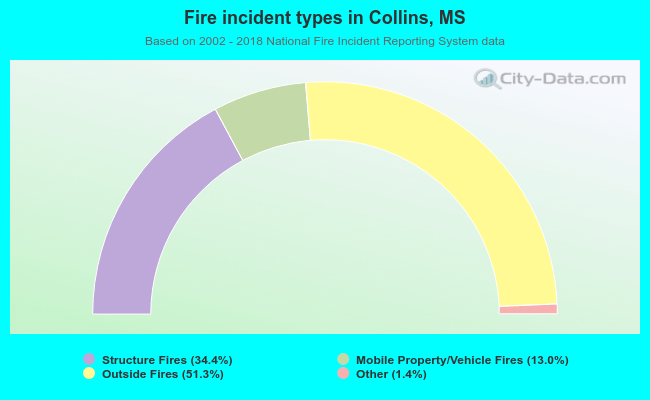 When looking into fire subcategories, the most reports belonged to: Outside Fires (51.3%), and Structure Fires (34.4%).