Collegeville: Fire Incidents, Pennsylvania (PA)
Where are fire incidents reported in Collegeville, PA
Something went wrong! Please refresh the page.
|
| |||||||||||||||||||||||||||||||||||||||||||||||||||||||||||||||||||||||||||||||||||||||||||||||||||||||||||||
2004 - 2018 National Fire Incident Reporting System (NFIRS) incidents
- Incident types reported to NFIRS in Collegeville, PA
- 32026.0%False Alarm
- 31926.0%Fire
- 27322.2%Hazardous Condition
- 1109.0%Service Call
- 998.1%Good Intent Call
- 977.9%Rescue & EMS
- 50.4%Special Incident
- 40.3%Overpressure Rupture
- 20.2%Severe Weather
- Fire incident types reported to NFIRS in Collegeville, PA
- 19260.2%Structure Fires
- 9730.4%Outside Fires
- 237.2%Mobile Property/Vehicle Fires
- 72.2%Other
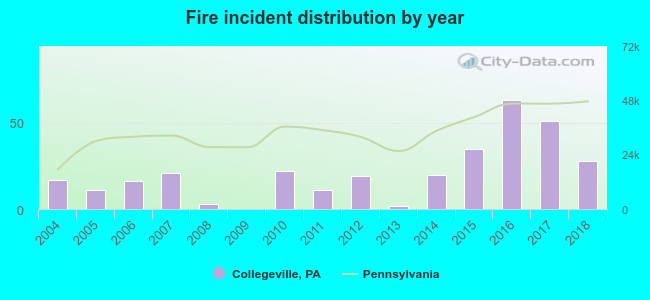 Based on the data from the years 2004 - 2018 the average number of fires per year is 21. The highest number of fire incidents - 63 took place in 2016, and the least - 0 in 2009. The data has a rising trend.
The average number of yearly fire incidents per 10k residents in Collegeville, PA compared to nearest cities:
(Note: Based on data for the last 3 years, including only cities with population 5,000 and above)
| Collegeville: | 88.9 |
| Trooper: | 7.5 |
| Audubon: | 30.8 |
| Phoenixville: | 65.7 |
| West Norriton: | 4.1 |
| East Norriton: | 30.3 |
| Harleysville: | 12.9 |
| King of Prussia: | 82.4 |
| Norristown: | 98.0 |

 Based on the reports from the years 2004 - 2018 the average number of fire-related yearly casualties is 0. The highest number of casualties - 1 took place in 2004, and the lowest - 0 in 2005. The data has a declining trend.
 30.4% incidents where reported in the morning and 69.6% in the evening. The most fires (16.3%) took place on Tuesday, and the least (10.7%) on Monday.
 According to the 319 fires from years 2004 - 2018 most fires (11.9%) took place during February, and the least (5.0%) in October.
 Out of all 1,229 cases reported during the years 2004 - 2018, the most belonged to the categories: False Alarm (26.0%), Fire (26.0%), and Hazardous Condition (22.2%).
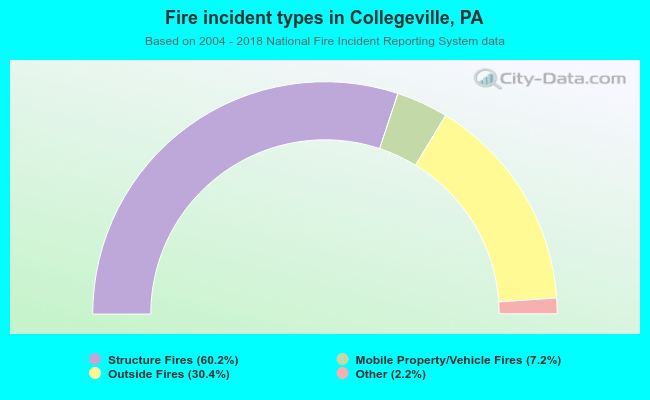 When looking into fire subcategories, the most incidents belonged to: Structure Fires (60.2%), and Outside Fires (30.4%).