Coleman: Fire Incidents, Florida (FL)
Where are fire incidents reported in Coleman, FL
Something went wrong! Please refresh the page.
|
| |||||||||||||||||||||||||||||||||||||||||||||||||||||||||||||||||||||||||||||||||||||||||||||||||||||||||||||
2002 - 2018 National Fire Incident Reporting System (NFIRS) incidents
- Incident types reported to NFIRS in Coleman, FL
- 63853.6%Rescue & EMS
- 15813.3%Fire
- 14912.5%Good Intent Call
- 13711.5%Hazardous Condition
- 998.3%Service Call
- 80.7%False Alarm
- Fire incident types reported to NFIRS in Coleman, FL
- 9761.4%Outside Fires
- 3119.6%Mobile Property/Vehicle Fires
- 2717.1%Structure Fires
- 31.9%Other
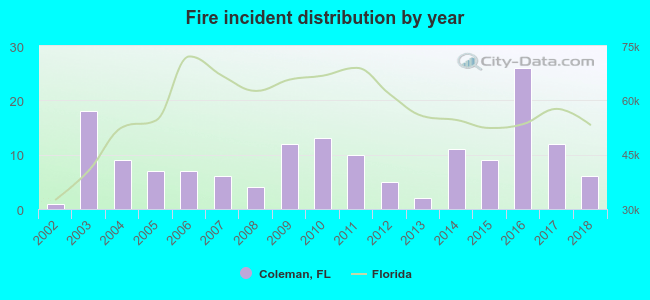 Based on the data from the years 2002 - 2018 the average number of fire incidents per year is 9. The highest number of reported fires - 26 took place in 2016, and the least - 1 in 2002. The data has a growing trend.
 28.5% incidents where reported in the morning and 71.5% in the evening. The most fires (19.0%) took place on Saturday, and the least (11.4%) on Tuesday.
 Based on the 158 reports from years 2002 - 2018 most fires (15.2%) took place during May, and the least (4.4%) in October.
 Out of all 1,190 cases reported during the years 2002 - 2018, the most belonged to the categories: Overpressure Rupture (53.6%), Fire (13.3%), and Service Call (12.5%).
 When looking into fire subcategories, the most incidents belonged to: Outside Fires (61.4%), and Mobile Property/Vehicle Fires (19.6%).