| Fire incidents reported |
|---|
| Sreet name | Count |
|---|
| ROUTE 26 | 14 | | MAIN STREET | 10 | | ROUTE 3 | 10 | | TITUS HILL ROAD | 8 | | CARLTON HILL RD. | 6 | | COLBY STREET | 6 | | ROUTE 145 | 6 | | EDWARDS ST. | 4 | | EDWARDS STREET | 4 | | FISH HATCHERY ROAD | 4 | | MAIN ST | 4 | | PARSONS STREET | 4 | | PLEASENT STREET | 4 | | POLLY'S PLACE LANE | 4 | | REED ROAD | 4 | | RTE. 26 | 4 | | SOUTH HILL ROAD | 4 | | SPRING STREET | 4 | | STREET | 4 | | 2ND STREET | 2 | | AIRPORT ROAD | 2 | | ALDRICH RD. | 2 | | BAILEY ROAD | 2 | | BEAR ROCK ROAD | 2 | | BENNETT HILL ROAD | 2 |
| | | Fire incidents reported |
|---|
| Sreet name | Count |
|---|
| BLAKELY FARM RD | 2 | | BLAKELY FARM RD. | 2 | | BRIDGE ST. | 2 | | CARLETON HILL ROAD | 2 | | CARLTON HILL | 2 | | CARLTON HILL RD | 2 | | COLBY ST | 2 | | COLBY ST. | 2 | | COUTURE STREET | 2 | | CROSBY TERRACE | 2 | | EAST COLEBROOK ROAD | 2 | | EDWARDS ST | 2 | | EVERGREEN ROAD | 2 | | GOLF LINKS RD | 2 | | GOULD ST | 2 | | HARVEY SWELL ROAD | 2 | | HIGH STREET | 2 | | INDIAN TRAIL ROAD | 2 | | JACKSON ROAD | 2 | | LOMBARD STREET | 2 | | LYNCH ROAD | 2 | | MAIN ST. | 2 | | MARSHALL HILL RD | 2 | | MERRILL ST | 2 | | OLD HOMESTEAD ROAD | 2 |
|
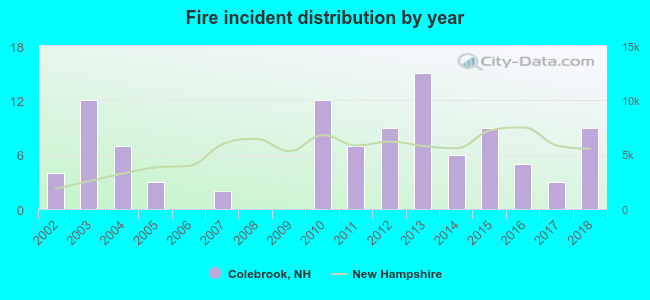 According to the data from the years 2002 - 2018 the average number of fires per year is 6. The highest number of fires - 15 took place in 2013, and the least - 0 in 2006. The data has a growing trend.
 37.9% incidents where reported in the morning and 62.1% in the evening. The most fires (20.4%) took place on Tuesday, and the least (9.7%) on Wednesday.
 According to the 103 fire incident reports from years 2002 - 2018 most fires (15.5%) took place during April, and the least (1.9%) in July.
 Out of all 370 cases reported during the years 2002 - 2018, the most belonged to the categories: Fire (27.8%), Hazardous Condition (27.8%), and Rescue & EMS (21.9%).
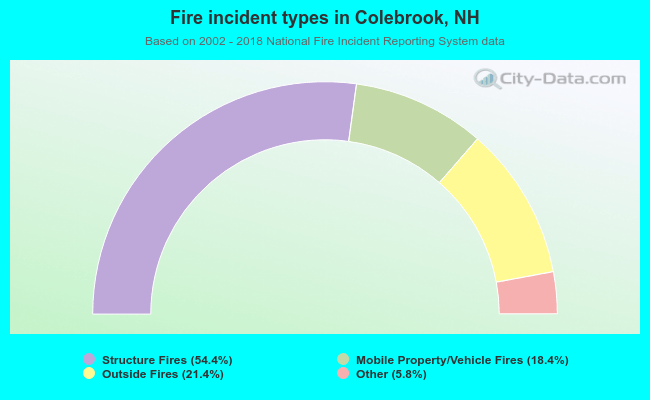 When looking into fire subcategories, the most incidents belonged to: Structure Fires (54.4%), and Outside Fires (21.4%).