Clintonville: Fire Incidents, Wisconsin (WI)
Where are fire incidents reported in Clintonville, WI
Something went wrong! Please refresh the page.
|
| |||||||||||||||||||||||||||||||||||||||||||||||||||||||||||||||||||||||||||||||||||||||||||||||||||||||||||||
2003 - 2018 National Fire Incident Reporting System (NFIRS) incidents
- Incident types reported to NFIRS in Clintonville, WI
- 48647.8%Fire
- 21721.3%Hazardous Condition
- 13913.7%Rescue & EMS
- 818.0%False Alarm
- 434.2%Severe Weather
- 232.3%Service Call
- 232.3%Good Intent Call
- 40.4%Overpressure Rupture
- Fire incident types reported to NFIRS in Clintonville, WI
- 23949.2%Structure Fires
- 14028.8%Outside Fires
- 5611.5%Other
- 5110.5%Mobile Property/Vehicle Fires
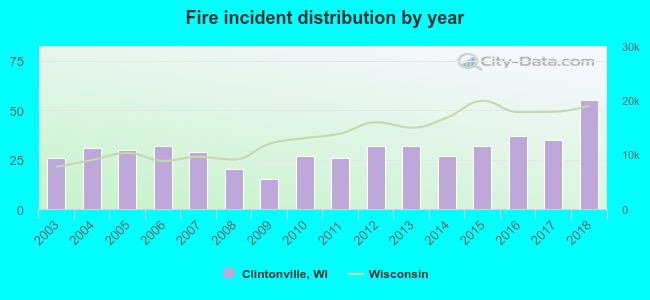 Based on the data from the years 2003 - 2018 the average number of fires per year is 30. The highest number of fires - 55 took place in 2018, and the least - 15 in 2009. The data has a growing trend.
 31.7% incidents where reported in the morning and 68.3% in the evening. The most fires (16.7%) took place on Saturday, and the least (11.3%) on Sunday.
 Based on the 486 fire incident reports from years 2003 - 2018 most fires (11.1%) took place during April, and the least (4.9%) in June.
 Out of all 1,017 cases reported during the years 2003 - 2018, the most belonged to the categories: Fire (47.8%), Hazardous Condition (21.3%), and Rescue & EMS (13.7%).
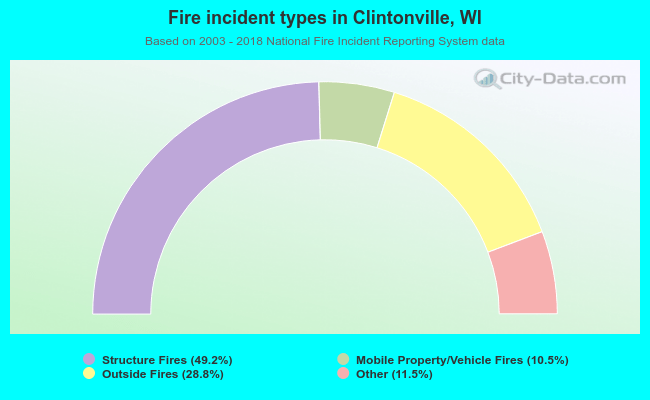 When looking into fire subcategories, the most reports belonged to: Structure Fires (49.2%), and Outside Fires (28.8%).