Clinton: Fire Incidents, South Carolina (SC)
Where are fire incidents reported in Clinton, SC
Something went wrong! Please refresh the page.
|
| |||||||||||||||||||||||||||||||||||||||||||||||||||||||||||||||||||||||||||||||||||||||||||||||||||||||||||||
| Other | 174 | |||||||||||||||||||||||||||||||||||||||||||||||||||||||||||||||||||||||||||||||||||||||||||||||||||||||||||||
2005 - 2018 National Fire Incident Reporting System (NFIRS) incidents
- Incident types reported to NFIRS in Clinton, SC
- 2,12544.4%Rescue & EMS
- 71014.8%Fire
- 63113.2%Good Intent Call
- 4549.5%False Alarm
- 4329.0%Service Call
- 3908.2%Hazardous Condition
- 270.6%Severe Weather
- 150.3%Special Incident
- Fire incident types reported to NFIRS in Clinton, SC
- 27438.6%Outside Fires
- 26337.0%Structure Fires
- 15521.8%Mobile Property/Vehicle Fires
- 182.5%Other
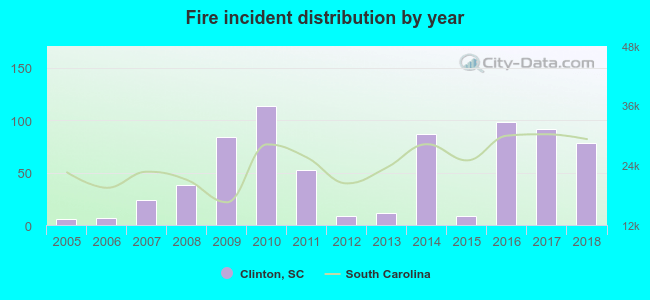 According to the data from the years 2005 - 2018 the average number of fire incidents per year is 51. The highest number of reported fires - 114 took place in 2010, and the least - 6 in 2005. The data has a rising trend.
The average number of yearly fire incidents per 10k residents in Clinton, SC compared to nearest cities:
(Note: Based on data for the last 3 years, including only cities with population 5,000 and above)
| Clinton: | 103.6 |
| Laurens: | 164.5 |
| Newberry: | 88.9 |
| Union: | 106.5 |
| Pauline: | 25.2 |
| Fountain Inn: | 150.0 |
| Greenwood: | 120.8 |
| Simpsonville: | 61.9 |
| Mauldin: | 30.6 |
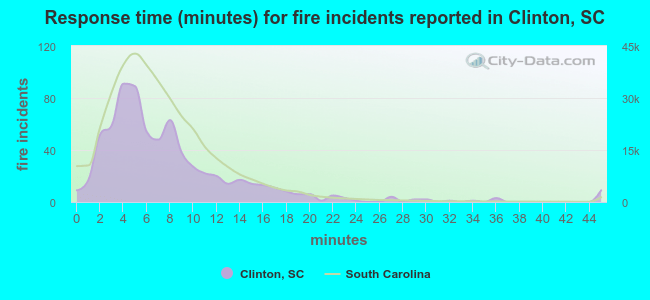 The median response time based on all reported fire incidents is 6 minutes. This is similar to the state median value.
The median response time in Clinton, SC compared to nearest cities:
(Note: Based on data for all years, including only cities with at least 500 fire incidents)
| Clinton: | 6 minutes |
| Laurens: | 7 minutes |
| Gray Court: | 10 minutes |
| Newberry: | 5 minutes |
| Woodruff: | 10 minutes |
| Ware Shoals: | 8 minutes |
| Union: | 6 minutes |
| Fountain Inn: | 7 minutes |
| Greenwood: | 5 minutes |
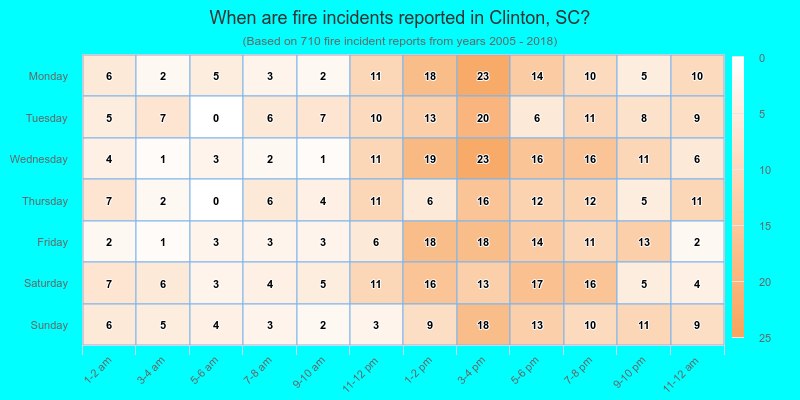
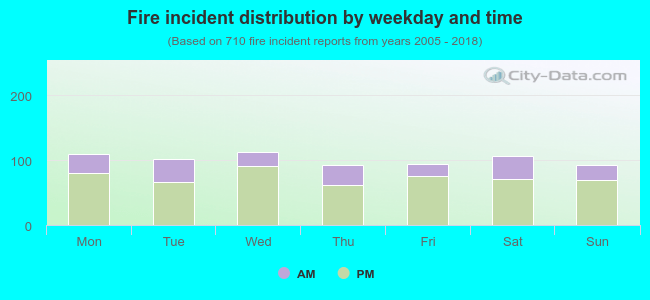 27.2% incidents where reported in the morning and 72.8% in the evening. The most fires (15.9%) took place on Wednesday, and the least (13.0%) on Thursday.
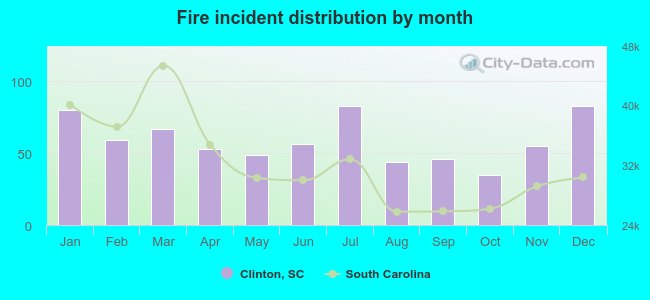 According to the 710 reports from years 2005 - 2018 most fires (11.7%) took place during July, and the least (4.9%) in October.
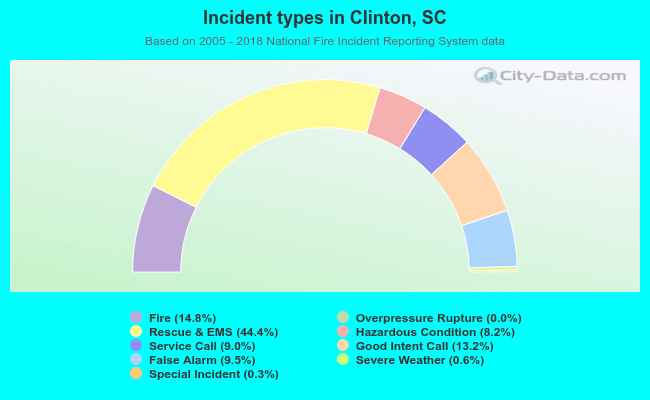 Out of all 4,785 cases reported during the years 2005 - 2018, the most belonged to the categories: Rescue & EMS (44.4%), Fire (14.8%), and Good Intent Call (13.2%).
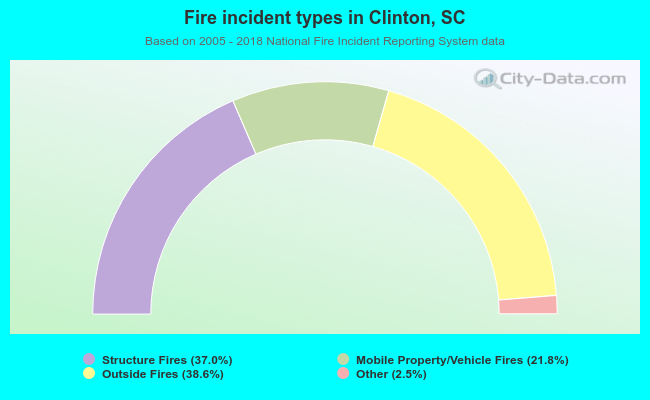 When looking into fire subcategories, the most reports belonged to: Outside Fires (38.6%), and Structure Fires (37.0%).