| Fire incidents reported |
|---|
| Sreet name | Count |
|---|
| LE CENTER MUTUAL AID | 10 | | 440 TH STREET | 6 | | LAKE HENRY BOAT LANDING | 6 | | SCOTCH LAKE RD | 6 | | 00 | 4 | | 111 10TH ST | 4 | | 24401 SCOTCH LAKE RD | 4 | | 267 TH AVE | 4 | | 271 ST STREET | 4 | | 41 WALNUT ST | 4 | | 410TH STREET | 4 | | COUNTY RD 104 | 4 | | COUNTY RD 15 | 4 | | COUNTY RD 2 | 4 | | HUB DRIVE | 4 | | KASOTA MUTUAL AID | 4 | | MADISON LAKE MUTUAL AID | 4 | | RIDGE RD | 4 | | SAVAGE LAKE ROAD | 4 | | SCOTCH LAKE RD | 4 | | SCOTCH LAKE ROAD | 4 | | SOUIX TRAIL | 4 | | STATE HWY 99 | 4 | | WEST JEFFERSON LANDING | 4 | | 101WALNUT ST | 2 |
| | | Fire incidents reported |
|---|
| Sreet name | Count |
|---|
| 1058 SAVIDGE LAKE RD | 2 | | 200 MONTGOMERY AVE LECENR | 2 | | 205 4TH ST | 2 | | 205 BROADWAY | 2 | | 23347 DODD RD | 2 | | 23956 DODD RD | 2 | | 24651 SCOTCH LAKE RD | 2 | | 24780 ARROW HEAD TRAIL | 2 | | 24802 ARROWHEAD TRAIL | 2 | | 24855 FRENCH DR | 2 | | 26087 ISLAND RD | 2 | | 26095 ISLAND RD | 2 | | 26116 SCOTCH LAKE RD | 2 | | 261ST AVE | 2 | | 261STAVE | 2 | | 261TH AVENUE | 2 | | 26282 SPRUCE LANE | 2 | | 26722 SOUIX TRAIL | 2 | | 281ST AVE | 2 | | 28526 LESUEUR CREEK RD | 2 | | 28636 WEST LAKE DRIVE | 2 | | 28673 4OOTH ST LESUER MN | 2 | | 29132 410TH ST | 2 | | 293RD AVE | 2 | | |
|
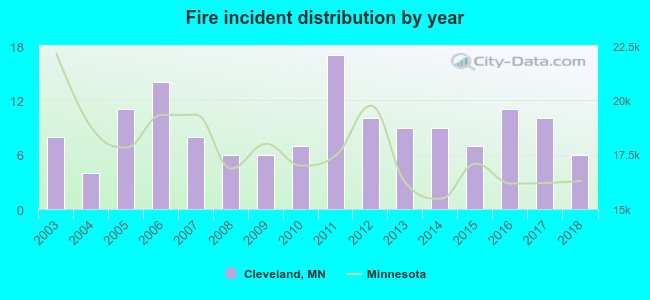 Based on the data from the years 2003 - 2018 the average number of fire incidents per year is 9. The highest number of fires - 17 took place in 2011, and the least - 4 in 2004. The data has a dropping trend.
 23.8% incidents where reported in the morning and 76.2% in the evening. The most fires (24.5%) took place on Saturday, and the least (8.4%) on Wednesday.
 According to the 143 fire incident reports from years 2003 - 2018 most fires (14.0%) took place during October, and the least (4.2%) in February.
 Out of all 479 cases reported during the years 2003 - 2018, the most belonged to the categories: Rescue & EMS (47.8%), Fire (29.9%), and Hazardous Condition (12.7%).
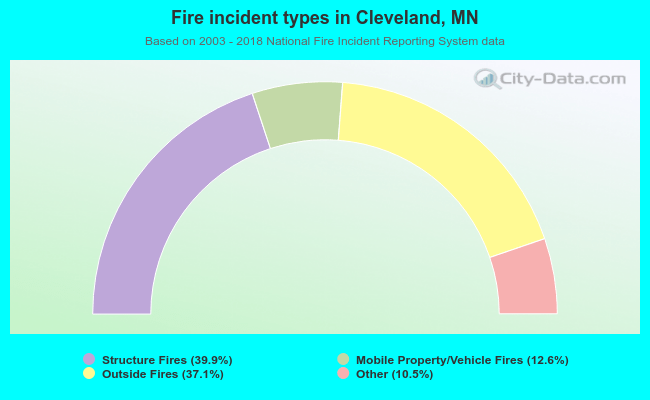 When looking into fire subcategories, the most incidents belonged to: Structure Fires (39.9%), and Outside Fires (37.1%).